|
|
| Line 1: |
Line 1: |
| | 50/50 Ar/CO<sub>2</sub> and cosmics, prototype horizontal | | 50/50 Ar/CO<sub>2</sub> and cosmics, prototype horizontal |
| | + | |
| | + | #Short runs for various HV, check pedestals |
| | | | |
| | {| border="0" cellpadding="2" | | {| border="0" cellpadding="2" |
| Line 34: |
Line 36: |
| | |[[Image:run_31809_thr5_fitamp20.png|thumb|x150px|Max amplitude ch20, hit threshold 5sigma ]] | | |[[Image:run_31809_thr5_fitamp20.png|thumb|x150px|Max amplitude ch20, hit threshold 5sigma ]] |
| | |} | | |} |
| | + | |
| | + | #Fit max amplitude histograms and find optimal HV |
| | | | |
| | Where to start the fit from. | | Where to start the fit from. |
| Line 102: |
Line 106: |
| | |122 | | |122 |
| | |} | | |} |
| | + | |
| | + | |
| | + | |
| | + | #Find best point to take as local pedestal |
| | | | |
| | Find out where to take local pedestal. These are plots of change in ADC value vs time relative to the threshold crossing time. | | Find out where to take local pedestal. These are plots of change in ADC value vs time relative to the threshold crossing time. |
| Line 110: |
Line 118: |
| | |} | | |} |
| | Mean goes through 0.5 and 1 at -17.2 and -14.4 for thr=5sigma | | Mean goes through 0.5 and 1 at -17.2 and -14.4 for thr=5sigma |
| | + | |
| | + | #Fit drift time histogram and find t-zero |
| | | | |
| | {| border="0" cellpadding="2" | | {| border="0" cellpadding="2" |
Revision as of 09:54, 25 October 2012
50/50 Ar/CO2 and cosmics, prototype horizontal
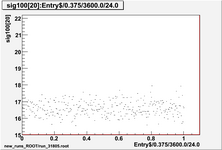
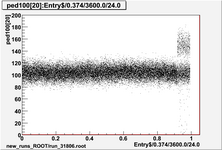
- Short runs for various HV, check pedestals
2050V, 50/50 gas, prototype horizontal
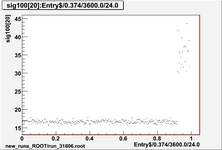
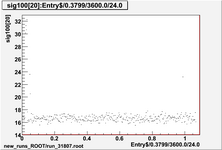
 Pedestal mean of samples 0-99, ch20, over 1 day |
 Pedestal std. dev. of samples 0-99, ch20, over 1 day |
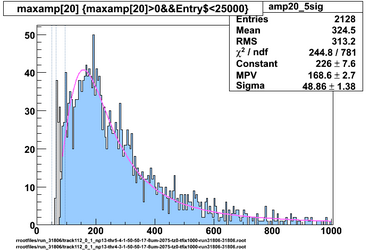
 Max amplitude ch20, hit threshold 4sigma |
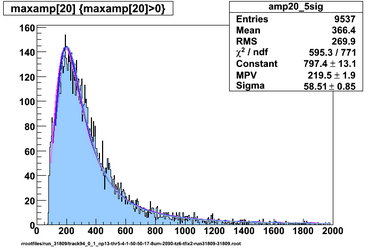
 Max amplitude ch20, hit threshold 5sigma |
2075V, 50/50 gas, prototype horizontal
 Pedestal mean of samples 0-99, ch20, over 1 day |
 Pedestal std. dev. of samples 0-99, ch20, over 1 day |
 Max amplitude ch20, hit threshold 4sigma, excluding last 7k events |
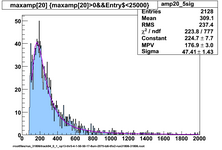 Max amplitude ch20, hit threshold 5sigma, excluding last 7k events |
2100V, 50/50 gas, prototype horizontal
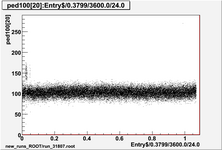 Pedestal mean of samples 0-99, ch20, over 1 day |
 Pedestal std. dev. of samples 0-99, ch20, over 1 day |
 Max amplitude ch20, hit threshold 4sigma, excluding first 2k events |
 Max amplitude ch20, hit threshold 5sigma, excluding first 2k events |
2090V, 50/50 gas, prototype horizontal
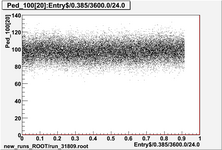 Pedestal mean of samples 0-99, ch20, over 1 day |
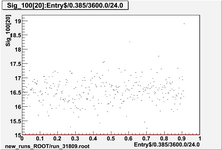 Pedestal std. dev. of samples 0-99, ch20, over 1 day |
 Max amplitude ch20, hit threshold 4sigma |
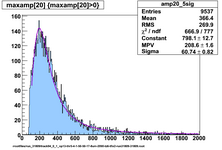 Max amplitude ch20, hit threshold 5sigma |
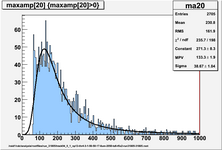
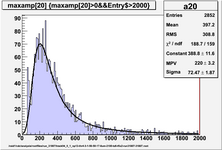
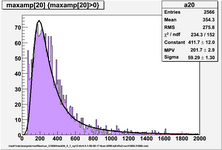
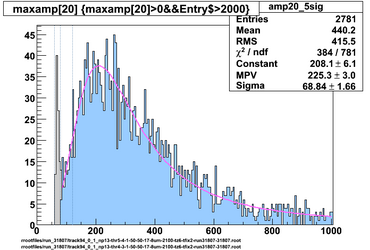
- Fit max amplitude histograms and find optimal HV
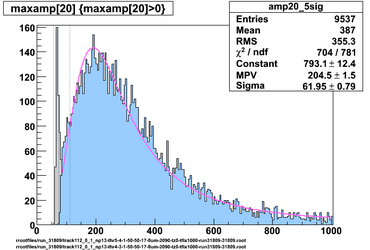
Where to start the fit from.
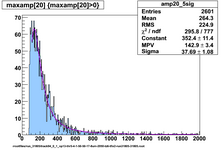
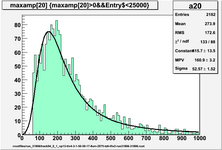
50/50 gas, prototype horizontal, 4sigma (gray) and 5sigma (blue) hit threshold, fit range 6sigma+
 2090V, Landau fits, log likelihood method, fit range starting at 5, 6, 7, 8 x pedestal sigma |
|
The fits started at higher amplitude underestimate the width. Fit range starting at 5pedestalsigma has MPV 204.5, Sigma 61.9, MPV/Sigma 3.3.
Fit range starting at 6pedestalsigma has MPV 208.6, Sigma 60.7, MPV/Sigma 3.4.
Fit range starting at 7pedestalsigma has MPV 213.7, Sigma 59.5, MPV/Sigma 3.6.
Use 5pedestalsigma start.
50/50 gas, prototype horizontal, 4sigma (gray) and 5sigma (blue) hit threshold, fit range 5sigma+
 2075V, lines show 99.7%, 99% and 95% of landau summed 0-4000 (51, 66, 95) |
 2090V, lines show 99.7%, 99% and 95% of landau summed 0-4000 (55, 74, 111) |
 2100V, lines show 99.7%, 99% and 95% of landau summed 0-4000 (59, 80, 121) |
50/50 gas, noise std dev 16.5, hit threshold 5x16.5 = 82.5
| HV
|
Fit MPV
|
Fit sigma (FWHM/4)
|
Fit 4sigma/MPV
|
MPV/sigma
|
4045/MPV
|
99% point
|
97% point
|
95% point
|
| 2075
|
169
|
49
|
1.16
|
3.5
|
24
|
66
|
84
|
95
|
| 2090
|
204
|
62
|
1.21
|
3.3
|
20
|
74
|
97
|
111
|
| 2100
|
225
|
69
|
1.22
|
3.3
|
18
|
80
|
106
|
122
|
- Find best point to take as local pedestal
Find out where to take local pedestal. These are plots of change in ADC value vs time relative to the threshold crossing time.
2090V 50/50 Change in ADC value vs time relative to the threshold crossing time (in units of 8ns/5)
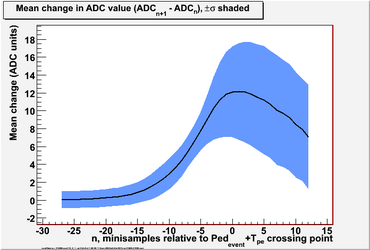 2090V, hit thr 5 ped-sigma |
Mean goes through 0.5 and 1 at -17.2 and -14.4 for thr=5sigma
- Fit drift time histogram and find t-zero
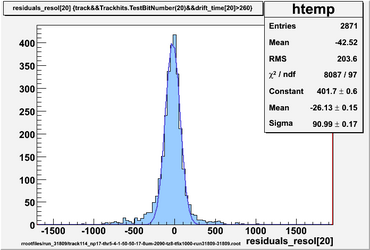
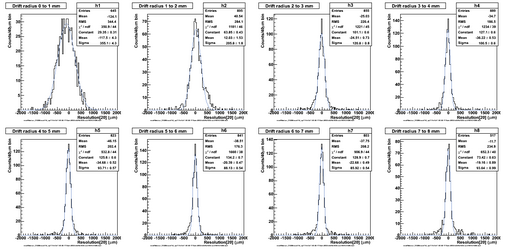
Drift time for 2090V, hit thresholds 5sigma, timing thresholds 4sigma, 1sigma, pedestal at t(5sig)-17, tz_add=0
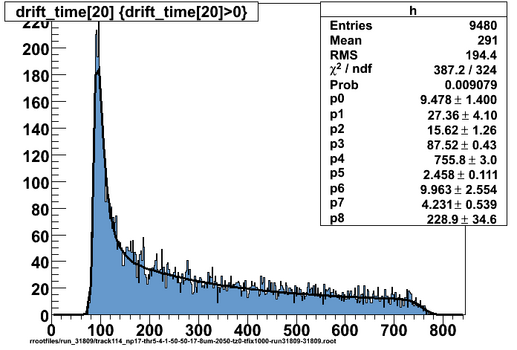 2090V, hit threshold 5sigma, time thresholds 4 and 1 sigma Estimate of t0 is 88 and tmax is 756, difference is 668, straight-line intercept is 79.2, to match histogram fit t0, use tz_add 8.4 |
|
Max drift time according to Garfield is 663ns for 50/50 Ar/CO2, 671ns for 49.5/50.5, 678ns for 49/51.
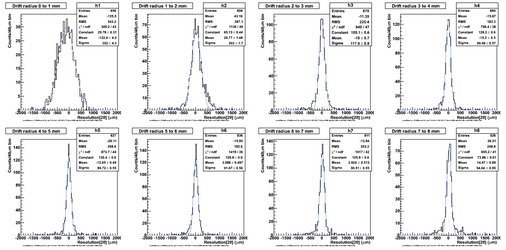
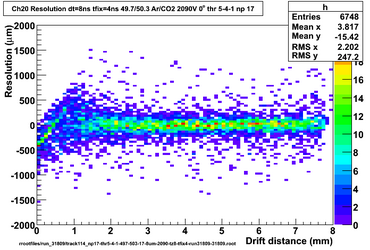
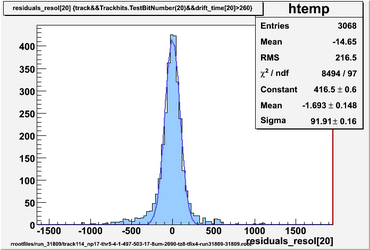
Resolution for 2090V, hit thresholds 5sigma, timing thresholds 4sigma, 1sigma, pedestal at t(5sig)-17, tz_add=8, 50/50 Garfield
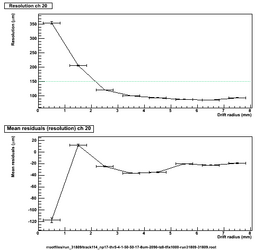
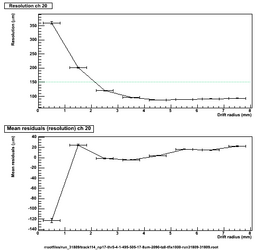
 50/50 Garfield, resolution ch 20 |
 50/50 Garfield, resolution vs hit radius |
 50/50 Garfield, resolution ch 20 for tracks of radius 5mm+ |
Resolution for 2090V, hit thresholds 5sigma, timing thresholds 4sigma, 1sigma, pedestal at t(5sig)-17, tz_add=8, 49.7/50.3 Garfield
 49.7/50.3 Garfield, resolution ch 20 |
 49.7/50.3 Garfield, resolution vs hit radius |
 49.7/50.3 Garfield, resolution ch 20 for tracks of radius 5mm+ |
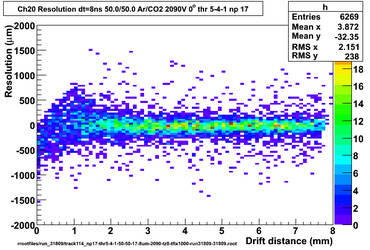
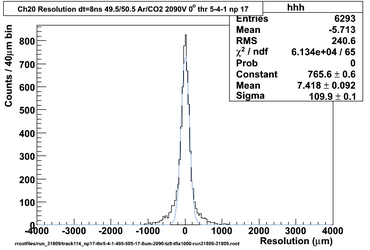
Resolution for 2090V, hit thresholds 5sigma, timing thresholds 4sigma, 1sigma, pedestal at t(5sig)-17, tz_add=8, 49.5/50.5 Garfield
 49.5/50.5 Garfield, resolution ch 20 |
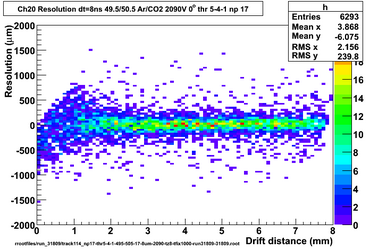 49.5/50.5 Garfield, resolution vs hit radius |
 49.5/50.5 Garfield, resolution ch 20 for tracks of radius 5mm+ |
Resolution for 2090V, hit thresholds 5sigma, timing thresholds 4sigma, 1sigma, pedestal at t(5sig)-17, tz_add=8, 50/50 Garfield
 50/50 Garfield, resolution vs track radius |
 50/50 Garfield, resolution vs track radius |
Resolution for 2090V, hit thresholds 5sigma, timing thresholds 4sigma, 1sigma, pedestal at t(5sig)-17, tz_add=8, 49.7/50.3 Garfield
 49.7/50.3 Garfield, resolution vs track radius |
 49.7/50.3 Garfield, resolution vs track radius |
Resolution for 2090V, hit thresholds 5sigma, timing thresholds 4sigma, 1sigma, pedestal at t(5sig)-17, tz_add=8, 49.5/50.5 Garfield
 49.5/50.5 Garfield, resolution vs track radius |
 49.5/50.5 Garfield, resolution vs track radius |
Include previously ignored hits which arrived before tzero+tz_add, assign these to a fixed drift time
2090V 49.5/50.5 Garfield etc Resolution for np=17, tz_add=8ns, hits before t-zero reassigned
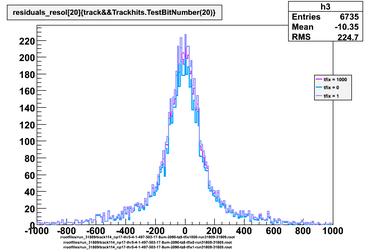 tfix = 1000 (ignored), 0, 1ns |
|
Fit with sum of 2 gaussians
2090V 49.5/50.5 Garfield etc Resolution for np=17, tz_add=8ns, hits before t-zero reassigned
|
|
|
|
|
|
|
|
Resolution for 2090V, 49.7/50.3 Garfield, hit thresholds 5sigma, timing thresholds 4sigma, 1sigma, pedestal at t(5sig)-17, tz_add=8, tfix=4ns
 49.7/50.3 Garfield, resolution ch 20 |
 49.7/50.3 Garfield, resolution vs hit radius |
 49.7/50.3 Garfield, resolution ch 20 for tracks of radius 5mm+ |


