Difference between revisions of "Test Stand at FSU"
(→Time difference resolution) |
|||
| (10 intermediate revisions by the same user not shown) | |||
| Line 7: | Line 7: | ||
##The HV for the two TOF PMTs are set to provide average signal amplitudes of about 300mV with the trigger paddles located at the center of the TOP paddle. The HV of the right PMT is 1400V and 1600V for the left PMT. The gain of the right PMT at 1750 was measured to be 4.6e6 while the left PMT gain a 1750V is found to be 1.3e6. Here a screen shot of the scope and similarly if the trigger paddles are moved 17" from the right PMT. At this location the signal of the left PMT reduced to about 200mV while the signal from the right PMT increased to about 600mV(yellow):<br>[[Image:tof_paddle_signals_average.gif|200px]] [[Image:tof_paddle_signals_trig_17inch_from_right.gif|angle=90|200px]]<br> | ##The HV for the two TOF PMTs are set to provide average signal amplitudes of about 300mV with the trigger paddles located at the center of the TOP paddle. The HV of the right PMT is 1400V and 1600V for the left PMT. The gain of the right PMT at 1750 was measured to be 4.6e6 while the left PMT gain a 1750V is found to be 1.3e6. Here a screen shot of the scope and similarly if the trigger paddles are moved 17" from the right PMT. At this location the signal of the left PMT reduced to about 200mV while the signal from the right PMT increased to about 600mV(yellow):<br>[[Image:tof_paddle_signals_average.gif|200px]] [[Image:tof_paddle_signals_trig_17inch_from_right.gif|angle=90|200px]]<br> | ||
##Time difference histograms for the trigger paddles and for the TOF paddle:<br>[[Image:timediff_toptrig.gif|200px]] [[Image:timediff_bottrig.gif|200px]] [[Image:timediff_tofpaddle.gif|200px]]<br>The horizontal axis is in TDC channels with 0.025ns/ch. The width of the timing distribution of the trigger paddles is substantially larger than for the TOF paddle. The TOF paddle effective speed of light is about 16cm/ps. | ##Time difference histograms for the trigger paddles and for the TOF paddle:<br>[[Image:timediff_toptrig.gif|200px]] [[Image:timediff_bottrig.gif|200px]] [[Image:timediff_tofpaddle.gif|200px]]<br>The horizontal axis is in TDC channels with 0.025ns/ch. The width of the timing distribution of the trigger paddles is substantially larger than for the TOF paddle. The TOF paddle effective speed of light is about 16cm/ps. | ||
| − | ##ADC spectra for left and right TOF paddle. HV-left=1600V, HV-right=1400V<br>[[Image:adc_left.gif|ADC left PMT Gain=9.02e5|300px]] [[Image:adc_right.gif|ADC right PMT Gain=9.36e5|300px]]<br> | + | ##ADC spectra for left and right TOF paddle. HV-left=1600V(Gain=9.02e5), HV-right=1400V(Gain=9.36e5)<br>[[Image:adc_left.gif|ADC left PMT Gain=9.02e5|300px]] [[Image:adc_right.gif|ADC right PMT Gain=9.36e5|300px]]<br>The resulting number of photo electrons for the mean in both spectra are 534 for the left and 605 for the right PMT.<br>The gain has been evaluated from a fit the gain measurements outlined below.<br> |
| − | + | ||
| − | + | ==PMT Gains == | |
| + | The PMT gains of several Hamamatsu tubes have been determined using a 10-fold fast amplifier in the case of the 10-stage tubes and a series of 2 10-fold amplifiers in the case of an 8-stage tube. The LED used in this test generates UV light. The pulse sent to the LED is about 50ns long while the amplitude is adjusted to moderate the light output such that single photo electrons are clearly identified in the ADC spectrum. | ||
| + | <br> | ||
| + | <br> | ||
| + | PMT assemply H10534, WA0009 (not in use) | ||
<pre> | <pre> | ||
HV Gain | HV Gain | ||
| Line 20: | Line 24: | ||
1600 1.31e6 | 1600 1.31e6 | ||
</pre> | </pre> | ||
| − | + | <br> | |
| + | PMT assemply H10534, ZM6059 (right TOF paddle) | ||
<pre> | <pre> | ||
HV Gain | HV Gain | ||
| Line 27: | Line 32: | ||
1650 2.94e6 | 1650 2.94e6 | ||
</pre> | </pre> | ||
| − | + | <br> | |
| + | PMT assemply H10534, WA0010 (BR trigger paddle) | ||
<pre> | <pre> | ||
HV Gain | HV Gain | ||
| Line 34: | Line 40: | ||
1650 2.02e6 | 1650 2.02e6 | ||
</pre> | </pre> | ||
| − | + | <br> | |
| + | PMT assemply H10534, ??? (left TOF Paddle) | ||
<pre> | <pre> | ||
HV Gain | HV Gain | ||
| Line 40: | Line 47: | ||
1750 1.30e6 | 1750 1.30e6 | ||
</pre> | </pre> | ||
| − | + | <br> | |
| + | PMT assemply Hxxxxx, 8-stage tube | ||
<pre> | <pre> | ||
HV Gain | HV Gain | ||
| Line 46: | Line 54: | ||
1500 5.33e5 | 1500 5.33e5 | ||
</pre> | </pre> | ||
| + | <br> | ||
| + | The data fit well to a linear function in a log-log plot as illustrated below for PMT WA0009<br> | ||
| + | [[Image:gain_PMT_VA0009.gif|300px]]<br> The fit function is of the form f(x)=10^(a*log10(x)+b) and used to determine the gain of the left and right PMTs of the TOF paddle at 1600V and 1400V respectively.<br> | ||
| + | |||
| + | == PMT Currents == | ||
| + | The maximum current for these type of PMT tubes (R9779) is quoted as 0.1mA by the manufacturer Hamamatsu. This holds for both the 8-stage and the 10-stage tubes. Operating a PMT at this current will reduce the gain of the PMT by a factor of two after 1000 hours of operation. Currently we do not have experimental numbers on the gains while operating the PMT at high currents for extended periods of time. | ||
| + | |||
| + | We expect about 550 photo electrons from MIPs passing through the center of the TOF paddle. Assuming a gain of 1e6 this will result in a signal charge of 8.8e-11 Coulomb. For the central most paddle with the highest electromagnetic background Monte Carlo simulations estimate the mean energy deposition of this background to be about 70% of a MIP hence a mean signal charge of about 6.16e-11 Coulomb assuming the a gain of 1e6. If we assume that this paddle sees a background rate of 1MHz, this is the expected rate of | ||
| + | a 3cm wide paddle closest to the beam line at 1e7 gammas coherent peak luminosity, we expect a PMT anode current of about I=6.16e-11*1e6=0.062mA. | ||
| + | |||
| + | In this situation the mean signal amplitude for MIPs a the center of the TOF paddle is about 350mV to 400mV. Due to attenuation it is expected that signals will be reduced by about a factor of 2 to 2.3 for the far PMT if the MIP passes at one end of the paddle. This would result in a signal amplitude of about 152mV in the most conservative case. | ||
| + | |||
| + | |||
| + | == Time difference resolution == | ||
| + | Selecting events from the 2-dim distribution of the time difference of the TOP and BOTTOM trigger paddles one can test the timing resolution of the TOF paddle. The units in this plot are TDC channels which is 0.025ns per channel.<br> | ||
| + | [[Image:delta_t_top_vs_bot.gif|300px]]<br> | ||
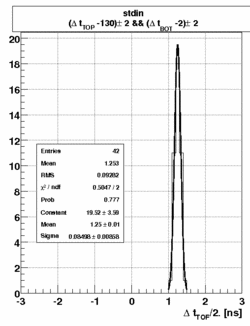
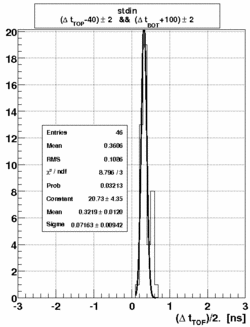
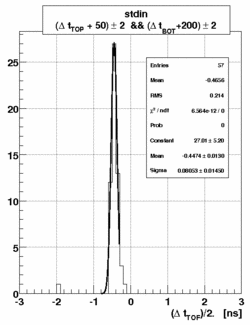
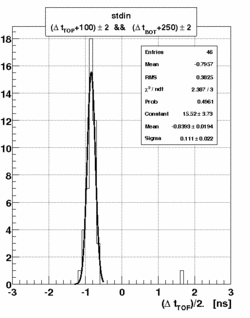
| + | In the following we select events within a narrow window in the top and bottom time difference at four different locations in the 2D plot and plot the time difference divided by 2 of the TOF paddle PMTs. | ||
| + | # TOP>130, TOP<135, BOT>0, BOT<5 <br> [[Image:delta_t_tof_1.gif|250px]] | ||
| + | # TOP>40, TOP<45, BOT>-100, BOT<-95 <br> [[Image:delta_t_tof_2.gif|250px]] | ||
| + | # TOP>-50, TOP<-45, BOT>-200, BOT<-195 <br> [[Image:delta_t_tof_3.gif|250px]] | ||
| + | # TOP>-100, TOP<-95, BOT>-250, BOT<-245 <br> [[Image:delta_t_tof_4.gif|250px]] | ||
Latest revision as of 09:25, 9 December 2011
Cosmic ray test stand at FSU
- Sketch of the electronics setup and trigger circuit.
- The Test Stand
- 2 Trigger paddle 3/4" thick, 6cm wide and 40cm long with PMTs on both ends are located above and below the TOF paddle which is 252cm long 6cm wide nad 1" thick. Also the TOF paddle is read out on both ends with PMTs.
- The 50 Ohm terminations at the PMTs were removed and linear FAN IN/OUT are introduced. The signals from the PMTs are directly connected to individual linear FAN IN/OUT channels. Each of these channels has its DC offset adjusted to be zero or slightly negative. One output of each linear FAN IN/OUT is connected to a JLAB VME discriminator and a second output is connected over delay cables to a CANE VME charge integrating ADC. The 4 PMTs from the trigger paddles from a 4-fold coincidence to generate a trigger signal. This trigger signal is set into coincidence with a DAQ latch level and the inverted BUSY signal from the TI.
- Picture of the detectors in the test stand:
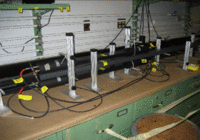
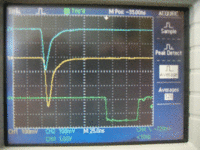
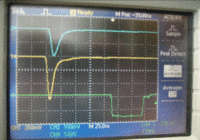
- The HV for the two TOF PMTs are set to provide average signal amplitudes of about 300mV with the trigger paddles located at the center of the TOP paddle. The HV of the right PMT is 1400V and 1600V for the left PMT. The gain of the right PMT at 1750 was measured to be 4.6e6 while the left PMT gain a 1750V is found to be 1.3e6. Here a screen shot of the scope and similarly if the trigger paddles are moved 17" from the right PMT. At this location the signal of the left PMT reduced to about 200mV while the signal from the right PMT increased to about 600mV(yellow):
- Time difference histograms for the trigger paddles and for the TOF paddle:
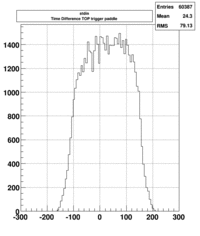
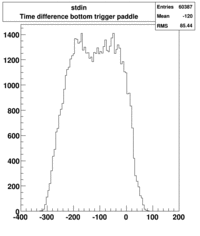
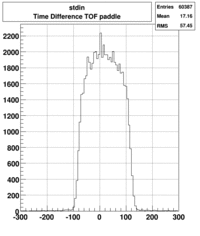
The horizontal axis is in TDC channels with 0.025ns/ch. The width of the timing distribution of the trigger paddles is substantially larger than for the TOF paddle. The TOF paddle effective speed of light is about 16cm/ps. - ADC spectra for left and right TOF paddle. HV-left=1600V(Gain=9.02e5), HV-right=1400V(Gain=9.36e5)
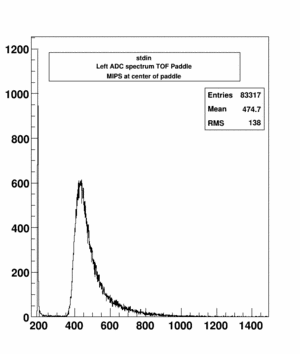
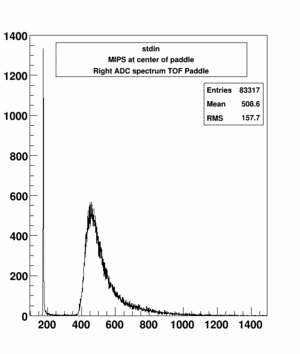
The resulting number of photo electrons for the mean in both spectra are 534 for the left and 605 for the right PMT.
The gain has been evaluated from a fit the gain measurements outlined below.
PMT Gains
The PMT gains of several Hamamatsu tubes have been determined using a 10-fold fast amplifier in the case of the 10-stage tubes and a series of 2 10-fold amplifiers in the case of an 8-stage tube. The LED used in this test generates UV light. The pulse sent to the LED is about 50ns long while the amplitude is adjusted to moderate the light output such that single photo electrons are clearly identified in the ADC spectrum.
PMT assemply H10534, WA0009 (not in use)
             HV       Gain
            2000    6.12e6
            1900    4.30e6
            1800    2.98e6
            1750    2.50e6
            1700    2.00e6
            1650    1.69e6
            1600    1.31e6
PMT assemply H10534, ZM6059 (right TOF paddle)
             HV       Gain
             1850    6.57e6
             1750    4.61e6
             1650    2.94e6
PMT assemply H10534, WA0010 (BR trigger paddle)
             HV       Gain
             1850    4.28e6
             1750    2.94e6
             1650    2.02e6
PMT assemply H10534, ??? (left TOF Paddle)
             HV       Gain
             1850    1.62e6
             1750    1.30e6
PMT assemply Hxxxxx, 8-stage tube
             HV       Gain
             1600    8.05e5
             1500    5.33e5
The data fit well to a linear function in a log-log plot as illustrated below for PMT WA0009
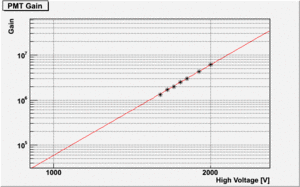
The fit function is of the form f(x)=10^(a*log10(x)+b) and used to determine the gain of the left and right PMTs of the TOF paddle at 1600V and 1400V respectively.
PMT Currents
The maximum current for these type of PMT tubes (R9779) is quoted as 0.1mA by the manufacturer Hamamatsu. This holds for both the 8-stage and the 10-stage tubes. Operating a PMT at this current will reduce the gain of the PMT by a factor of two after 1000 hours of operation. Currently we do not have experimental numbers on the gains while operating the PMT at high currents for extended periods of time.
We expect about 550 photo electrons from MIPs passing through the center of the TOF paddle. Assuming a gain of 1e6 this will result in a signal charge of 8.8e-11 Coulomb. For the central most paddle with the highest electromagnetic background Monte Carlo simulations estimate the mean energy deposition of this background to be about 70% of a MIP hence a mean signal charge of about 6.16e-11 Coulomb assuming the a gain of 1e6. If we assume that this paddle sees a background rate of 1MHz, this is the expected rate of a 3cm wide paddle closest to the beam line at 1e7 gammas coherent peak luminosity, we expect a PMT anode current of about I=6.16e-11*1e6=0.062mA.
In this situation the mean signal amplitude for MIPs a the center of the TOF paddle is about 350mV to 400mV. Due to attenuation it is expected that signals will be reduced by about a factor of 2 to 2.3 for the far PMT if the MIP passes at one end of the paddle. This would result in a signal amplitude of about 152mV in the most conservative case.
Time difference resolution
Selecting events from the 2-dim distribution of the time difference of the TOP and BOTTOM trigger paddles one can test the timing resolution of the TOF paddle. The units in this plot are TDC channels which is 0.025ns per channel.
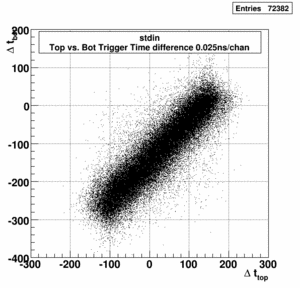
In the following we select events within a narrow window in the top and bottom time difference at four different locations in the 2D plot and plot the time difference divided by 2 of the TOF paddle PMTs.
