|
|
| (One intermediate revision by the same user not shown) |
| Line 99: |
Line 99: |
| | |+ Drift time for 2050V, hit thresholds 5sigma, timing thresholds 4sigma, 1sigma, pedestal at t(t4sig)-13, tz_add=0 | | |+ Drift time for 2050V, hit thresholds 5sigma, timing thresholds 4sigma, 1sigma, pedestal at t(t4sig)-13, tz_add=0 |
| | |width="400px"| | | |width="400px"| |
| − | |[[Image:run_31928_dt20.png|thumb|x250px|2050V, hit threshold 5sigma, time thresholds 4 and 1 sigma | + | |[[Image:run_31931_dt20.png|thumb|x250px|2050V, hit threshold 5sigma, time thresholds 4 and 1 sigma |
| − | Estimate of t0 is 104 and tmax is 727, difference is 623, diff between fit maximum and fit t0 is 5.9, straight-line intercept is 95.6, to match histogram fit t0, use tz_add 8.3 | + | Estimate of t0 is 104 and tmax is 727, difference is 622, diff between fit maximum and fit t0 is 6.0, straight-line intercept is 95.6, to match histogram fit t0, use tz_add 8.8 |
| | ]] | | ]] |
| | |} | | |} |
Latest revision as of 13:59, 18 March 2014
55/45 Ar/CO2 and cosmics, prototype horizontal
Short runs for range of HV, check pedestal is ok and find MPV
2000V, 55/45 gas, prototype horizontal
 Pedestal mean of samples 0-99, ch20, over 1 day |
 Pedestal std. dev. of samples 0-99, ch20, over 1 day |
2025V, 55/45 gas, prototype horizontal
 Pedestal mean of samples 0-99, ch20, over 1 day |
 Pedestal std. dev. of samples 0-99, ch20, over 1 day |
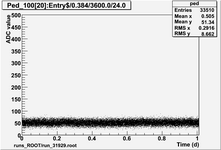
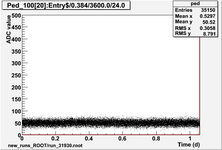
2050V, 55/45 gas, prototype horizontal
 Pedestal mean of samples 0-99, ch20, over 1 day |
 Pedestal std. dev. of samples 0-99, ch20, over 1 day |
2100V, 55/45 gas, prototype horizontal
 Pedestal mean of samples 0-99, ch20, over 1 day |
 Pedestal std. dev. of samples 0-99, ch20, over 1 day |
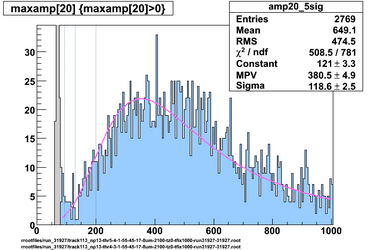
Fit max amplitude histograms and find optimal HV
55/45 gas, prototype horizontal, 4pedestalsigma (gray) and 5pedestalsigma (blue) hit threshold, fit range 5pedestalsigma+
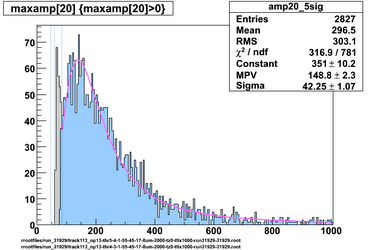 2000V, lines show 99.7%, 99% and 95% of landau summed 0-4000 (47, 60, 85) |
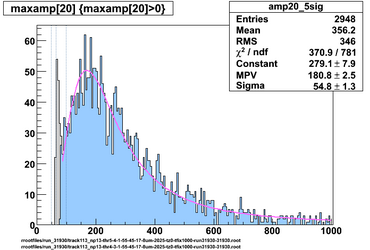 2025V, lines show 99.7%, 99% and 95% of landau summed 0-4000 (49, 65, 98) |
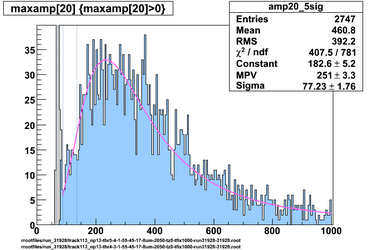 2050V, lines show 99.7%, 99% and 95% of landau summed 0-4000 (65, 88, 134) |
 2100V, lines show 99.7%, 99% and 95% of landau summed 0-4000 (94, 130, 201) |
55/45 gas, noise std dev 16.5, hit threshold 5x16.5 = 82.5, fit range 5pedestalsigma+
| HV
|
Fit MPV
|
Fit sigma (FWHM/4)
|
Fit 4sigma/MPV
|
MPV/sigma
|
4045/MPV
|
99% point
|
97% point
|
95% point
|
| 2000
|
149
|
42
|
1.14
|
3.5
|
27
|
60
|
76
|
85
|
| 2025
|
181
|
55
|
1.21
|
3.3
|
22
|
65
|
86
|
98
|
| 2050
|
251
|
77
|
1.23
|
3.2
|
16
|
88
|
117
|
134
|
| 2100
|
380
|
119
|
1.25
|
3.2
|
11
|
130
|
174
|
201
|
Fit drift time histogram
Drift time for 2050V, hit thresholds 5sigma, timing thresholds 4sigma, 1sigma, pedestal at t(t4sig)-13, tz_add=0
|
|
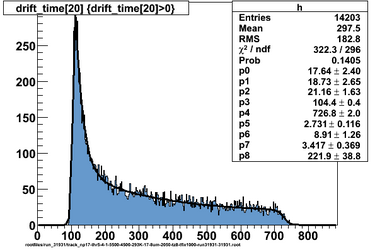 2050V, hit threshold 5sigma, time thresholds 4 and 1 sigma Estimate of t0 is 104 and tmax is 727, difference is 622, diff between fit maximum and fit t0 is 6.0, straight-line intercept is 95.6, to match histogram fit t0, use tz_add 8.8 |
Tracking efficiency plot
Tracks/Triggers, hit thresholds 5sigma, timing thresholds 4sigma, 1sigma, pedestal at t(5sig)-17
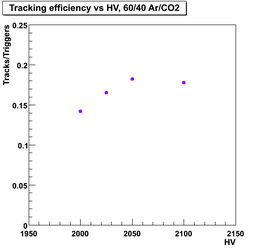 tzero=88ns, early hits ignored |
Look at position resolution, find best gas mix for Garfield x-t tables


