Difference between revisions of "TOF Timing TDC vs ADC"
| Line 1: | Line 1: | ||
The time difference <math>\Delta T</math> can be calculated from TDC data and ADC data independently and compared to each other. So can can plot the time difference from TDC vs. ADC where we define: | The time difference <math>\Delta T</math> can be calculated from TDC data and ADC data independently and compared to each other. So can can plot the time difference from TDC vs. ADC where we define: | ||
# <math>\Delta T_{TDC} = (T^{R}_{TDC} - T^{L}_{TDC})/2. </math> | # <math>\Delta T_{TDC} = (T^{R}_{TDC} - T^{L}_{TDC})/2. </math> | ||
| − | # <math>\Delta T_{ | + | # <math>\Delta T_{ADC} = (T^{R}_{ADC} - T^{L}_{ADC})/2. </math> |
In the case of the TDC data the times have been corrected for walk and the calibration offsets have been applied. The adc timing data are not corrected at all and used as is in the following plot: | In the case of the TDC data the times have been corrected for walk and the calibration offsets have been applied. The adc timing data are not corrected at all and used as is in the following plot: | ||
Latest revision as of 12:47, 17 June 2015
The time difference  can be calculated from TDC data and ADC data independently and compared to each other. So can can plot the time difference from TDC vs. ADC where we define:
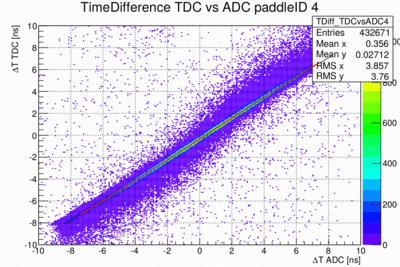
In the case of the TDC data the times have been corrected for walk and the calibration offsets have been applied. The adc timing data are not corrected at all and used as is in the following plot:
Shown here is  vs.
vs.  with a fit to the ridge. The fit function is not linear. As it turns out a much better fit function is
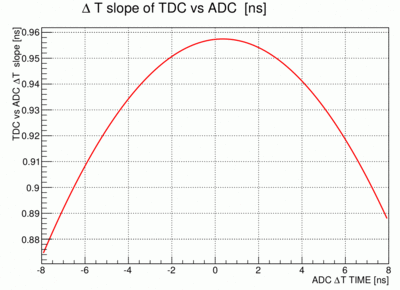
  . The derivative of this function is a measure of the slope as it changes as a function of the time difference of the ADC data. The slope is close to unity at the center of the paddle but does become smaller the further from the center the hits are. The slope as a function of
  is shown in the following plot:


