Difference between revisions of "CDC q vs n"
From GlueXWiki
| Line 13: | Line 13: | ||
|} | |} | ||
*The slight upward trend in q vs n (straw number) can also be seen in the plots of amplitude and q for rings 1 and 28. | *The slight upward trend in q vs n (straw number) can also be seen in the plots of amplitude and q for rings 1 and 28. | ||
| − | *The oscillations may be an artefact of the fitted Landau MPV moving with the data count in the histogram. | + | *The oscillations may be an artefact of the fitted Landau MPV moving with the data count in the histogram. ? What would cause this? |
*The troughs in the hit count correspond to troughs in the fitted MPV for q. ??? | *The troughs in the hit count correspond to troughs in the fitted MPV for q. ??? | ||
*The pedestal and amplitude vs n plots do not show huge oscillations, except in number of hits. | *The pedestal and amplitude vs n plots do not show huge oscillations, except in number of hits. | ||
Revision as of 20:48, 9 May 2016
Contents
[hide]Run 11559
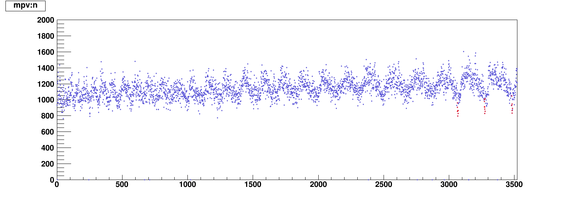
cosmics, April 20The above plot is the MPV of a Landau fitted to q for each straw vs straw number; straw numbers start with 1 in the innermost ring, beam left, and increase clockwise around the ring and then out to the next ring, etc. The low gain straws (red) are near the bottom of the CDC.
- The slight upward trend in q vs n (straw number) can also be seen in the plots of amplitude and q for rings 1 and 28.
- The oscillations may be an artefact of the fitted Landau MPV moving with the data count in the histogram. ? What would cause this?
- The troughs in the hit count correspond to troughs in the fitted MPV for q. ???
- The pedestal and amplitude vs n plots do not show huge oscillations, except in number of hits.
- There is a clear oscillation in the hit count vs straw number, which peaks at the sides of the CDC. This is because the mostly vertical cosmic ray tracks pass through many straws at the sides, but only a few above and below. The oscillations should not be present with beam data (but the data probably includes some cosmics).
To-do:
- Repeat with more data
- Use track info - ignore untracked hits
- Pick cosmics out of beam data?
- Beam data oscillations are more sawtooth than sine, why? Runs 11071-11383(?) have the cdc hole.
- Look at drift times
Run 10496
Run 10777
Run 11667
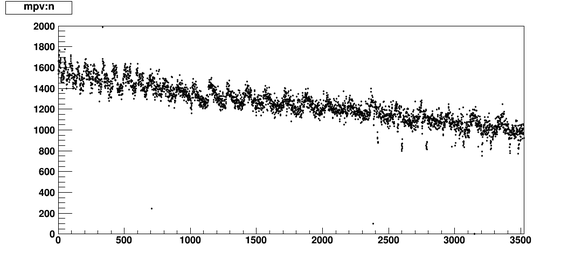
Low gain straws were n=3064 to 3070, 3270 to 3277, 3479 to 3277
Environment
| Run | date | beam (nA) | max drift (ns) | VERY approx q(3522) | pressure (bar) | temp U1 | temp U2 | temp U3 | temp U4 | temp D1 | temp D2 | temp D3 | temp D4 |
| 10496 | Feb 24 | 41 | 656 | 1350 | 99.71 | 23.3 | 23.2 | 23.6 | 24.1 | 25.4 | 25.5 | 24.8 | 25.2 |
| 10777 | Mar 6 | 100 | 665 | 1000 | 100.87 | 22.4 | 22.3 | 22.7 | 23.1 | 24.9 | 24.6 | 24.0 | 24.4 |
| 11559 | Apr 20 | cosmics | ? | 1150 | 101.24 | 21.9 | 21.8 | 22.0 | 22.4 | 24.3 | 23.2 | 23.0 | 23.2 |
| 11667 | Apr 25 | 120 | 672 | 1200 | 100.47 | 21.9 | 21.9 | 22.0 | 22.4 | 24.3 | 23.2 | 23.0 | 23.2 |


