Flatness plots and discussion
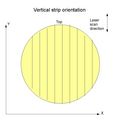
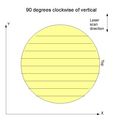
The plots on this page were generated using data collected with the old measurement system (made by Denny). Data from the new system is expected to reveal a much flatter cathode plane surface, and will not be susceptible to out of range issues. When the laser goes out of range, zeroes are plotted, causing jumps in the data. Cathode plane 4 refers to the high tension cathode plane, and vertical orientation means the copper strips are parallel to the x-axis (note that in this dataset, orientation is 90 degrees clockwise of vertical).
One line of data was taken down the center of a cathode plane to generate each curve plotted below. The cusps near 0.2 and 0.8 meters are where tape joins two sheets of kapton. Keep in mind that depth is a measure of distance between the laser and surface, so larger values are pits rather than hills.
The plot below on the left plots the raw data, revealing a rough contour of the cathode plane's surface. Datapoints are separated by approximately 500 microns in the y-direction, and by .0254 meters (1 inch) in the x_direction. To produce the rightmost plot, a mesh was superimposed on the plot and its height made to be proportional to that of the datapoints within. Jumps caused by out of range issues are visible at low x and y-values of this plot.
Each plotted point in the following plots is a measure of local depth variation. Lines in the plot above were divided into 20mm bins. Max Δ is the max bin value minus the min bin value. The larger datapoints have been discarded as they are a result of out of range errors. Even some of the points within the limits of these plots can be ignored, as many of them come from the border where the capton stretches over its frame (the copper strips do not extend this far). Excluding these outliers, the maximum change in a bin is about 300 microns.
Below is a second measure of local variation -- the RMS of each bin is plotted. Excluding outliers again here, the maximum RMS in a bin is < 200 microns.


