Start Counter Operations
Contents
Start Counter Response
Performance studies of the start counter over time. As is shown in plots below in terms of the response of the start counter paddle to hits in the nose cone is much stronger (yielding more photons) than in the straight section. Also, there is not much of a variation seen in the response for hits along the straight section. However, the mean detector response did degrade over time over the full length of the individual paddles. In general the mean detector signal peak in the straight section degraded from about 400 ADC counts in Run Period 40k to about 200 ADC counts in Run Period 120k with a larger variation from paddle to paddle. Similarly, the response in the nose section degraded too, where the degradation is also seen to be about a factor of 2. To illustrate this finding two plots are shown below of the mean Start counter response as a function of z position along the paddle (in units of "bins") for run 41388 and run 120848:
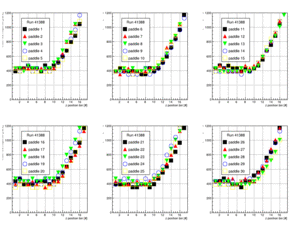
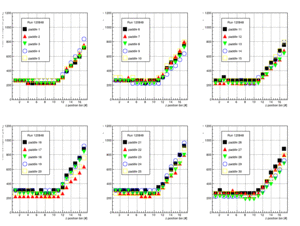
Overall, a degradation in the amplitude of a factor of 2 is seen. Note that the bias voltage has never been changed and is still the same value as at the start of GlueX operation.
Instead of looking at the ADC response as a function of z bin one can also look at some selected z bins 15(z=60+30cm), 12(z=60+24cm), 8(z=60+16cm) and looking at the response as a function of Run number. This is a better view to see how the response changed over time. The plots are in groups of 5 paddles per pad. There is some non negligible variation within a given Run Period. But a general trend can be identified that the signal response gets smaller over time.
BIN15: z=90cm 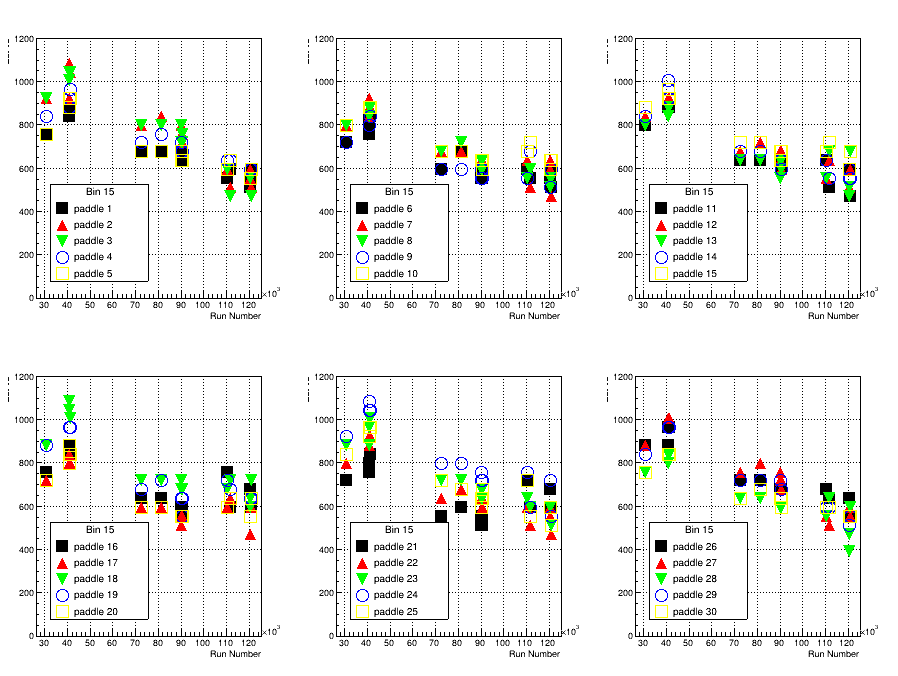
BIN12: z=84cm 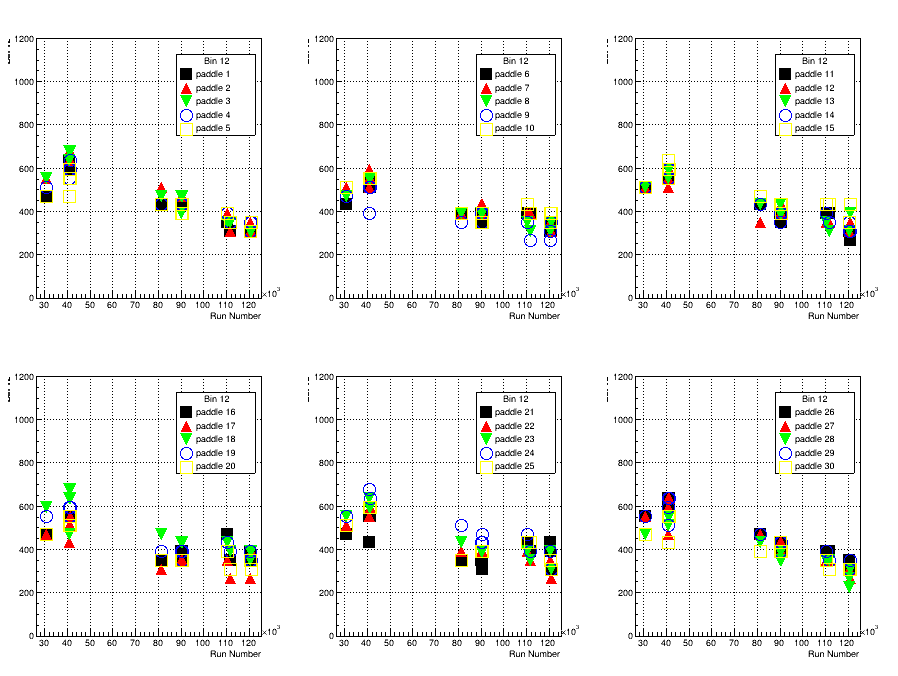
BIN08: z=76cm 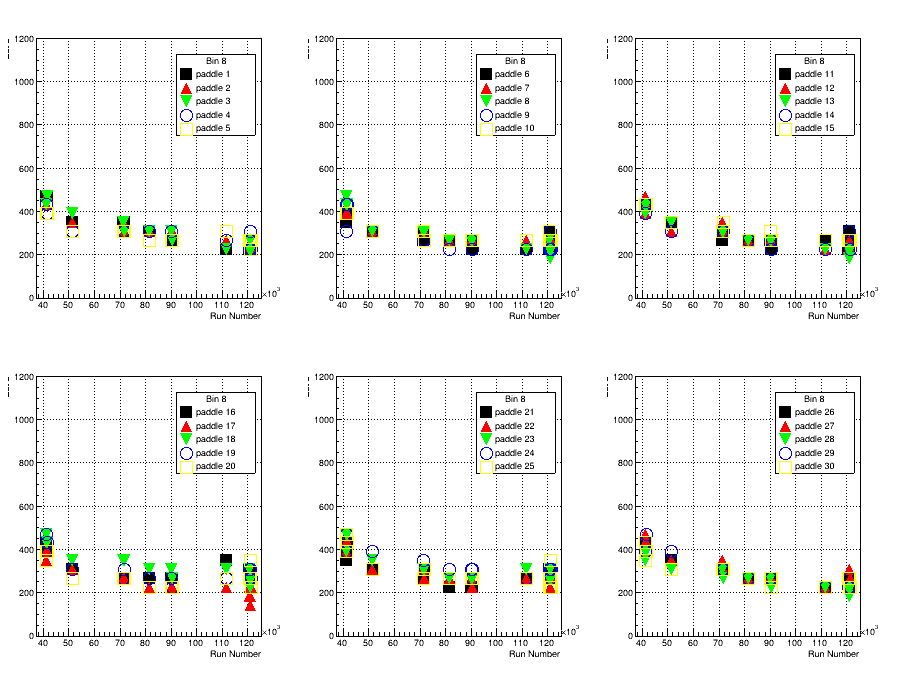
Plots of Start Counter response
- Detector response as a function of z location over time. The z-bin starts with 60cm and each bin covers 2cm so bin 2 is 62-64 cm and bin 17 is 84-86 cm. As an example paddle 3 bin 7 and bin 15 are compared between run 41835 and run 90660. It is clear that in the nose section (bin 15) the response is much larger (meaning more photons reach the SiPM)


Run Period Spring 2018
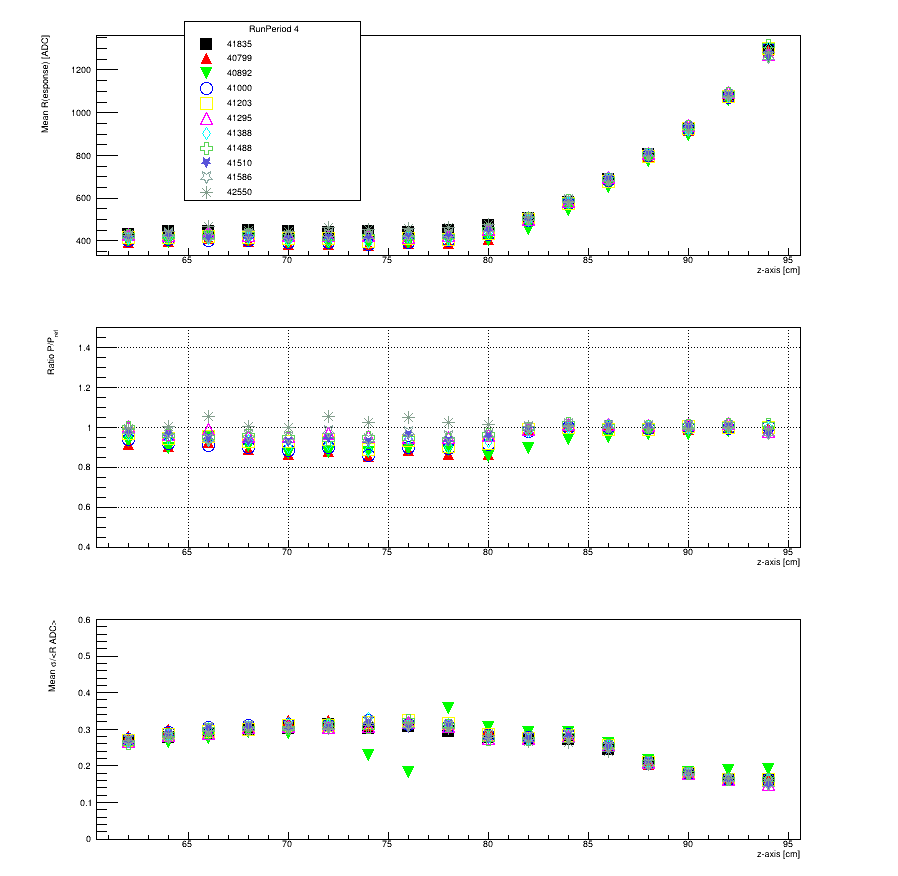
Continue using run 41835 as reference run comparing to its own run period shows that this particular run seems to be much lower in response and worse in resolution. Note that the data in run 40892 suffers from low statistics and causes the "deviations":
Run Period Fall 2018
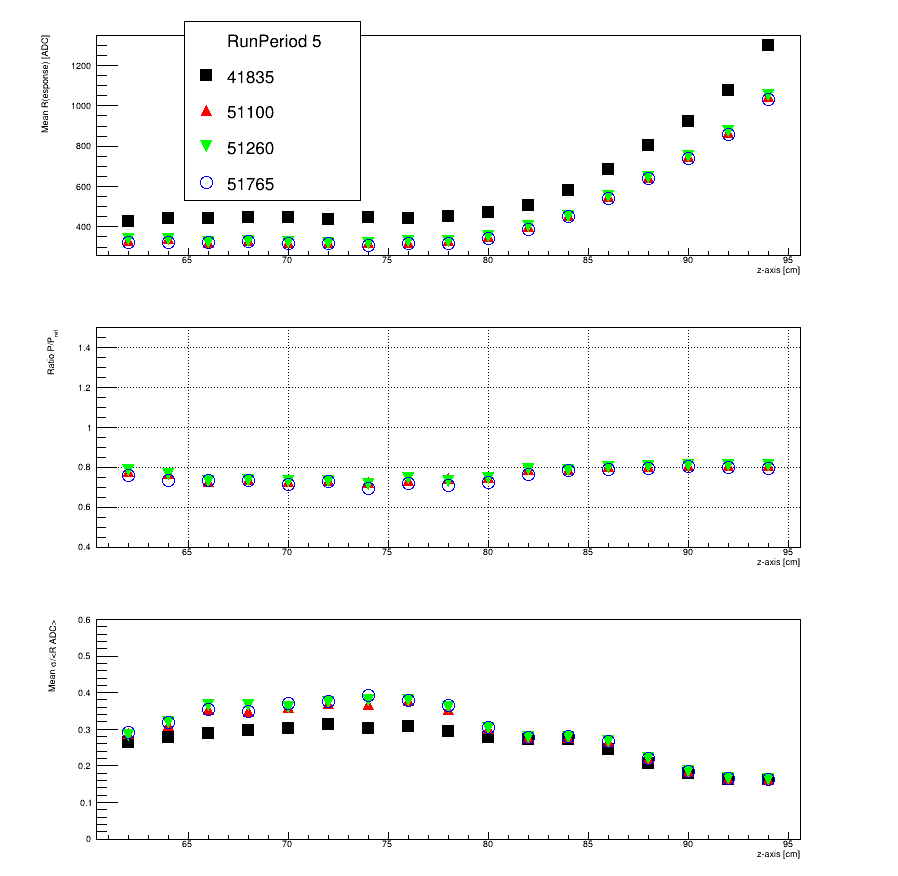
Continue using run 41835 as reference run comparing to Fall 2018 run period.
Run Period 2019/2020
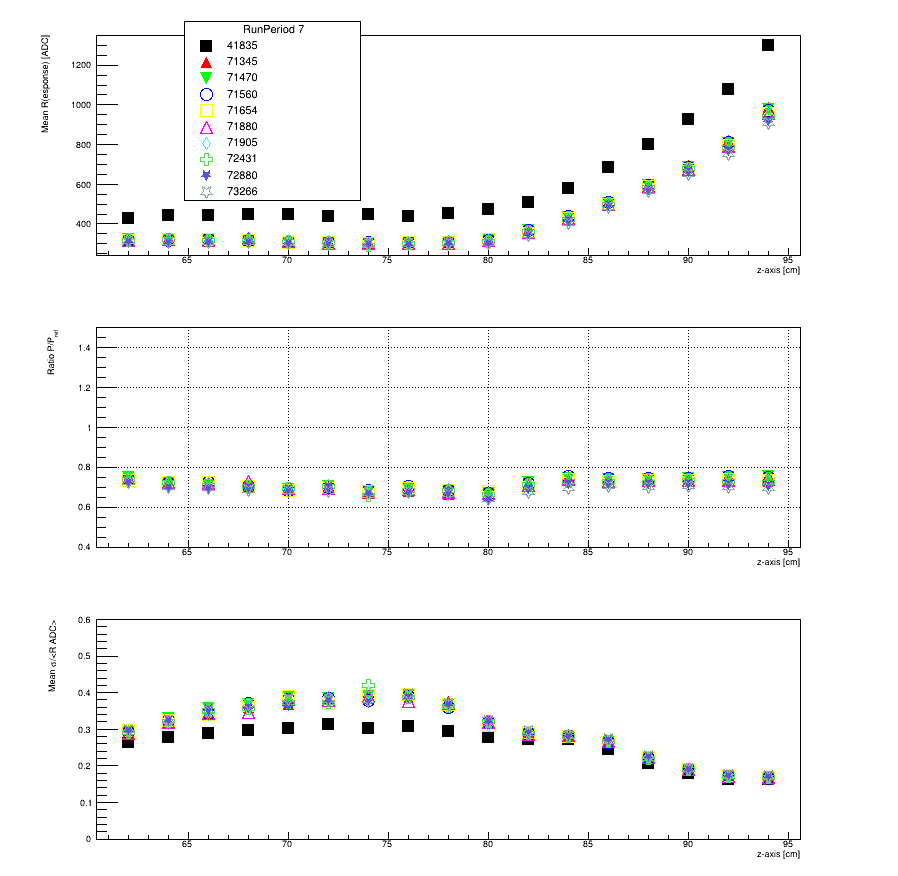
This run period covers run with run numbers 70k and represents the first run of gluex phase II.
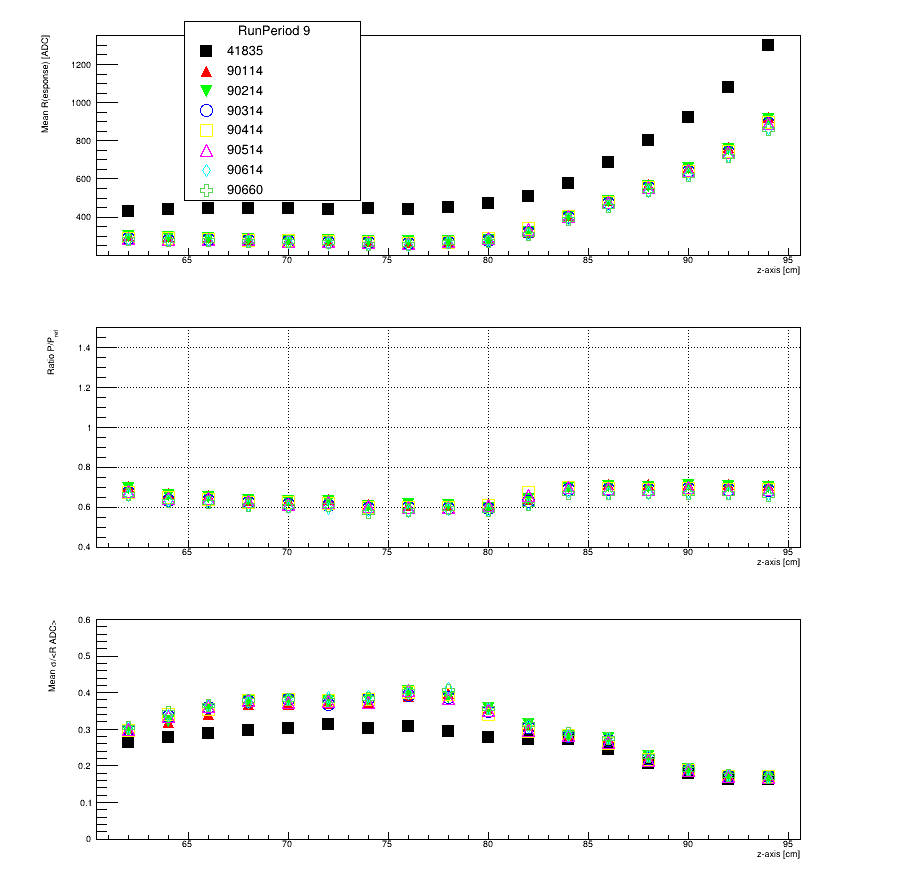
Run Period 2021 (SRC)
The following data is with runs 90k taken during the SRC experiment.
Run Period 2022 Fall
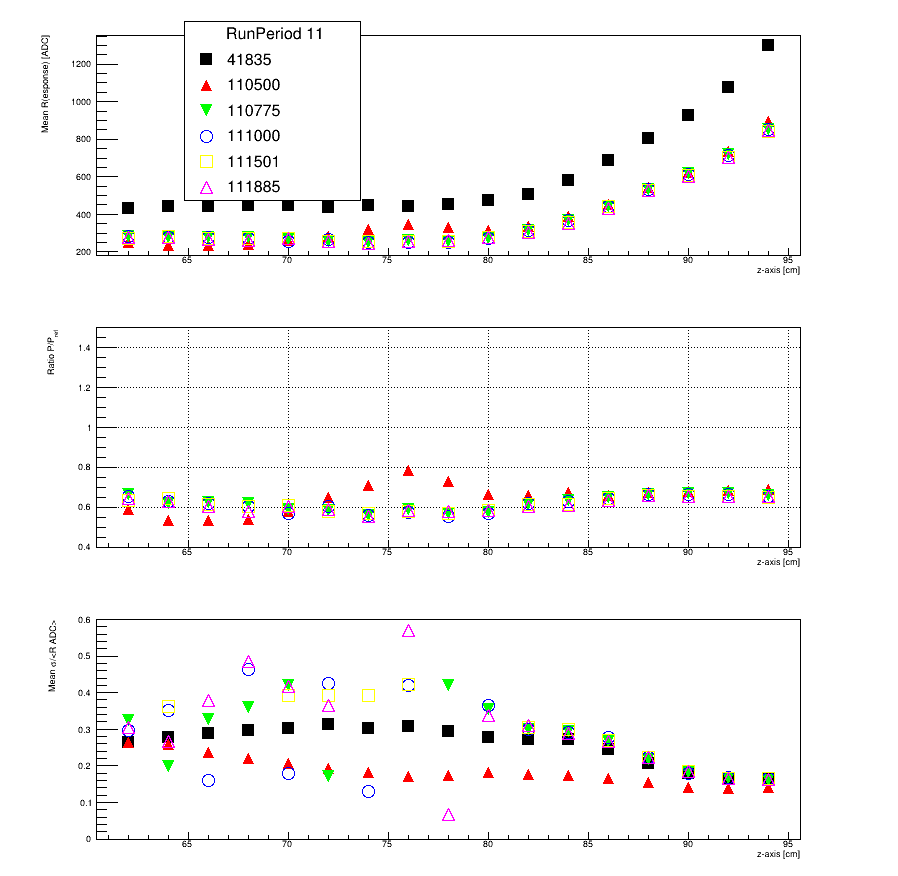
The following data is with runs 110k taken during the last PrimeX experiment period.
Run Period Winter 2023
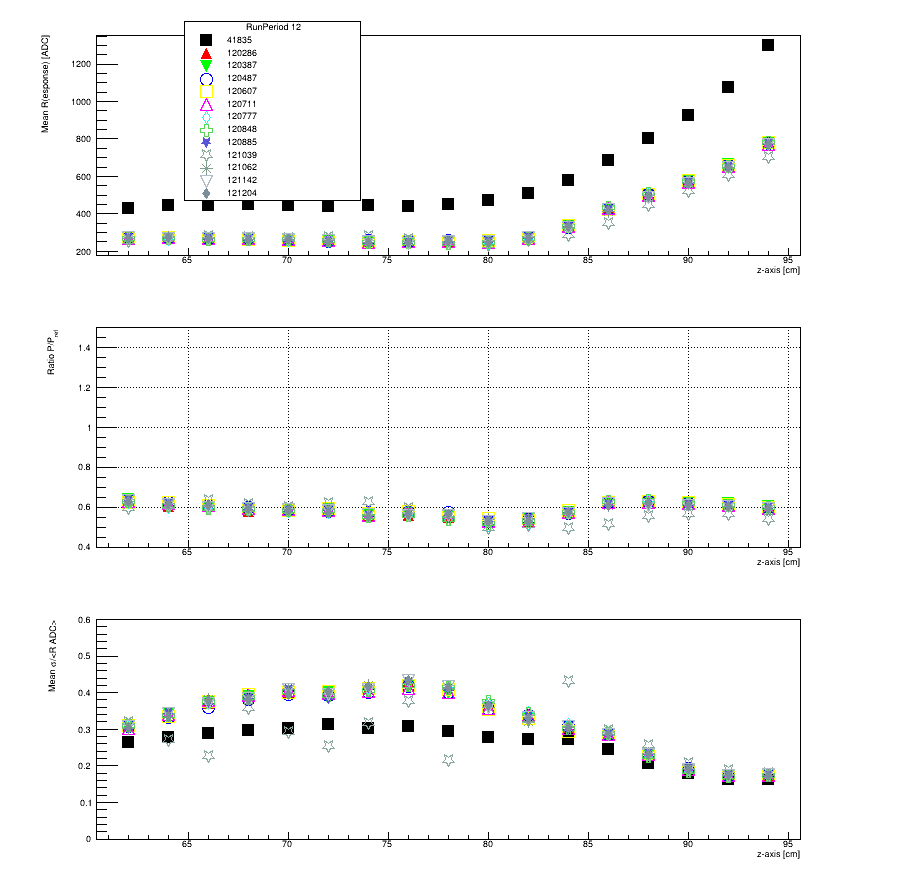
The following plot compares the mean paddel response in ADC counts and the width of the response devided by the mean ADC count of runs from winter 2023 with run 41835 of Run Period 2018 spring.
There is a clear indication that the response <ADC-peak> droped between spring 2018 (black points) and winter 2023 all other points (top plot). At the same time the ration of <width> divided by <ADC-Peak> does not change much. It is pretty much the same in the nose section, with a small increase in the transition region and straight section but again the same closer to the photo sensors. Note that z==60cm is still about 30cm? from the photo sensors.
Note the open stars represent run 121039 with is a high intensity test run at 900nA in raw mode with much less statistics per file.
Run Period 2017
[Start Counter Operations 2017]


