Start Counter Operations 2017
Start Counter Performance 2017
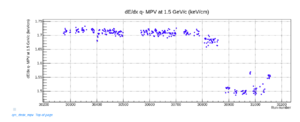
as of 2024:0921 the performance of the Start Counter can be interpreted by looking at the dEdx values shown in the SC deamon plot:

from these data one can clearly identify periods where there are significant changes that can be tradced back to changes in the response of the detector and is real and not an artefact of the calibration. For example, it can be shown that the ADC amplitudes of all the 30 paddles in run 30858 are about 7.8% larger than for run 30900. This is a significant change/drop in the response of the detector. This drop seems to happen immediate. There is no change in the operating voltage observed. And while the temperature of the CDC gas and the HallD air temperature monitored and recored in EPICS data base show some wired jumps around that time, the temperature became stable again at more or less previous values but the reduced response of the start counter paddles at the level of 7.8% remained almost to the end of the run Period. Starting with run 31046 there
is a smaller "jump" to a somewhat larger response again but still smaller than for earlier runs in the run period.
One can identify 4 distince time periods with different responses/gains of the start counter paddles based on the value of dEdx. These are:
Run 30000 to 30800
Run 30801 to 30880
Run 30888 to 31036
Run 31046 to end