Active Collimator
From GlueXWiki
- Active collimator prototyping and beam tests
- Richard's DNP-2012 presentation on the Hall D active collimator
- Igor's notes on the preamplifier power supply and control unit
- University of Connecticut Active Collimator Station Tutorial
Contents
Notes from meetings with Accelerator Group
High Speed DAQ for the Active Collimator
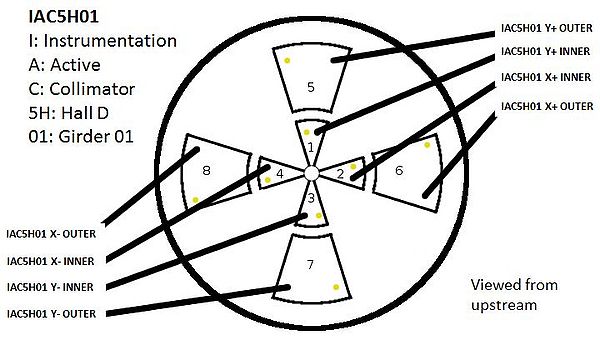
Active Collimator Naming Convention
- For EPICS PVs
- N9 corresponds to inner wedges
- N10 corresponds to outer wedges
- For Monticello plots
- I corresponds to inner wedges
- O corresponds to outer wedges
- Common to both EPICS and Monticello
- XP corresponds to X, plus
- XM corresponds to X, minus
- YP corresponds to Y, plus
- YM corresponds to Y, minus
- Cable diagram
High Speed ROOT File Writer
An EPICS IOC server is set up on gluon29.jlab.org:26064 to write the raw waveform data to /gluonraid1/Users/ac directory on demand.
The control of this High Speed DAQ can be found in Hall-D's EPICS GUI:
- Open CSS EPICS Control following these instructions
- From the Main Action Bar under the Beam heading, open the Active Collimator GUI.
- Start or Stop the High Speed ROOT File by clicking the button underneath the title.
- Once started, make sure the a new ROOT file is created and the File Size is increasing. In the box next to ROOT File it should say /gluonraid1/Users/ac/ac_YYYYMMDD_XXXXXX.root.
In very rare occasions, e.g. some one rebooted the AC DAQ server, the writer IOC needs to be restarted
- Reboot using command lines
- Log onto gluon29 using hdsys account
-
telnet localhost 26064 - Restart the IOC by keyboard combination Ctrl+X
- Exit the IOC proServer by keyboard combination Ctrl+]
- Exit the telnet by typing
quit
Analyze the Raw Data
Analyzing the data from the active collimator can be done in two ways.
- From Active Collimator GUI
- Click the Analyzer button in the active collimator GUI.
- This will open a new window. In the upper left select Open and select in the rawdata folder the root file to be analyzed.
- From a Linux terminal
- Log onto a gluon machine, e.g. gluon30.jlab.org, using account hdops:
ssh -X hdops@gluon30 - Enter acanalyzer directory:
cd ~/acanalyzer - Start the analyzer script:
./run - A new window will appear. In the upper left select Open and select in the rawdata folder the root file to be analyzed.
List of EPICS PVs
Here are the waveform records with size of 8192, N9 are inner and N10 are outer:
- Inner
iochdcol:BPM:N9:raw_XPiochdcol:BPM:N9:raw_XMiochdcol:BPM:N9:raw_YPiochdcol:BPM:N9:raw_YM
- Outer
iochdcol:BPM:N10:raw_XPiochdcol:BPM:N10:raw_XMiochdcol:BPM:N10:raw_YPiochdcol:BPM:N10:raw_YM
These are the 16-bit count readings for individual plates that are always available and filtered down to ~1Hz (same order as above):
- Inner
IOCHDCOL:VMICADC1_1IOCHDCOL:VMICADC2_1IOCHDCOL:VMICADC3_1IOCHDCOL:VMICADC4_1
- Outer
IOCHDCOL:VMICADC1_2IOCHDCOL:VMICADC2_2IOCHDCOL:VMICADC3_2IOCHDCOL:VMICADC4_2
And the gains:
IAC5H01I_GAINXPIAC5H01I_GAINXMIAC5H01I_GAINYPIAC5H01I_GAINYMIAC5H01I_GAINXPIAC5H01I_GAINXMIAC5H01I_GAINYPIAC5H01I_GAINYM
Expert view of raw AC waveforms in Monticello
The following is for experts only
- Connect to a gluon machine in the Hall D counting house
- In the terminal window type the command
monticello - In the Monticello screen, move the mouse to the BPM menu item and click the left-most button to reveal a pop-up menu. Select Hall D Active Collimator Diagnostics from the bottom of the popup menu. This will pop up a new window with the active collimator information.
- Make sure the following are selected
- iochdcol
- SEE Norm Ops
- FastSee Light On
- Update Mode Continuous
- To change the sampling rate go to the lower left corner of the GUI where it says samples to avg (500kHz) and change it to the desired value. This will reduce the rate by the factor you enter.
- On the left-hand side the gains for each wedge can be changed, if required.
- Go to Raw Wire Data Graph button near the bottom right and you can open the plots for the inner and outer plates.
- Within this new window you can change the axes ranges by right clicking on an axis. This will pop up a new window that has options for the min and max for each axis.
