Difference between revisions of "1GeV photons in TOF"
From GlueXWiki
| Line 1: | Line 1: | ||
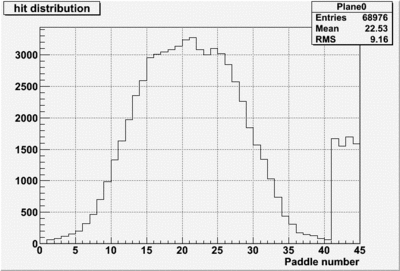
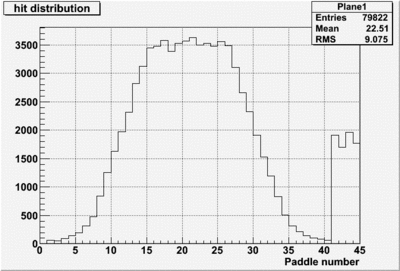
In this study 1GeV +/- 0.1 GeV were generated between 1 and 11 degree polar angle and from 0 to 360 degree in phi.<br> | In this study 1GeV +/- 0.1 GeV were generated between 1 and 11 degree polar angle and from 0 to 360 degree in phi.<br> | ||
The number of hits per plane as a function of paddle number is shown below for both TOF planes:<br> | The number of hits per plane as a function of paddle number is shown below for both TOF planes:<br> | ||
| − | [[Image:plane0_hitdist_1gevphotons.gif|400px]] [[Image:plane1_hitdist_1gevphotons.gif]] <br> | + | [[Image:plane0_hitdist_1gevphotons.gif|400px]] [[Image:plane1_hitdist_1gevphotons.gif|400px]] <br> |
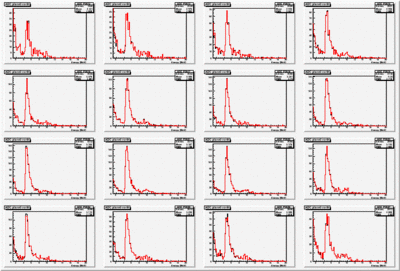
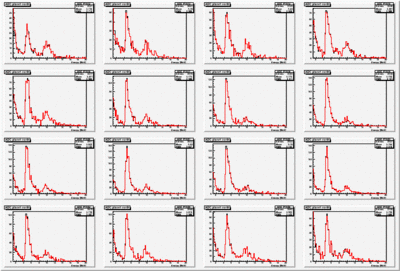
At this point no low energy threshold cut is applied. In the following the energy distribution of these hits is shown as | At this point no low energy threshold cut is applied. In the following the energy distribution of these hits is shown as | ||
seen on both ends of the paddle. Again for both planes where the first plot shows the more upstream TOF plane.<br> | seen on both ends of the paddle. Again for both planes where the first plot shows the more upstream TOF plane.<br> | ||
| − | [[Image:paddle_energy_dep_plane0.gif|400px]] [[Image:paddle_energy_dep_plane1.gif]]<br> | + | [[Image:paddle_energy_dep_plane0.gif|400px]] [[Image:paddle_energy_dep_plane1.gif|400px]]<br> |
The black histogram is the left/up PMT the red histogram is the right/down PMT. | The black histogram is the left/up PMT the red histogram is the right/down PMT. | ||
Revision as of 08:30, 21 July 2010
In this study 1GeV +/- 0.1 GeV were generated between 1 and 11 degree polar angle and from 0 to 360 degree in phi.
The number of hits per plane as a function of paddle number is shown below for both TOF planes:


At this point no low energy threshold cut is applied. In the following the energy distribution of these hits is shown as
seen on both ends of the paddle. Again for both planes where the first plot shows the more upstream TOF plane.


The black histogram is the left/up PMT the red histogram is the right/down PMT.