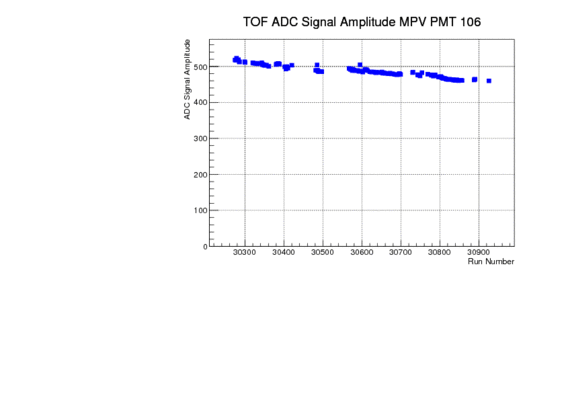
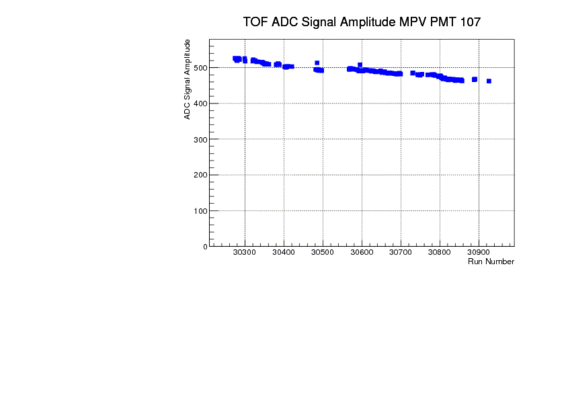
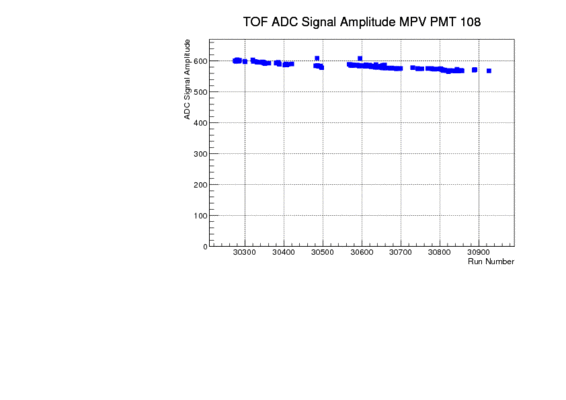
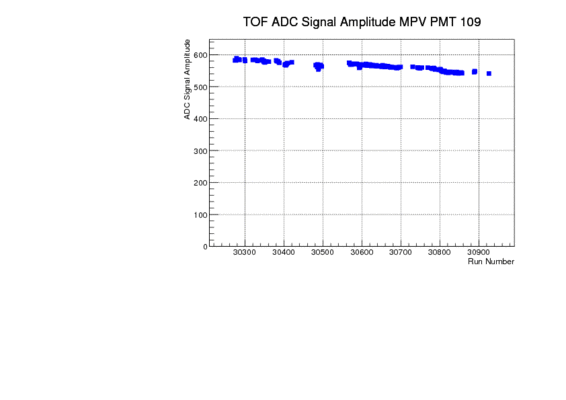
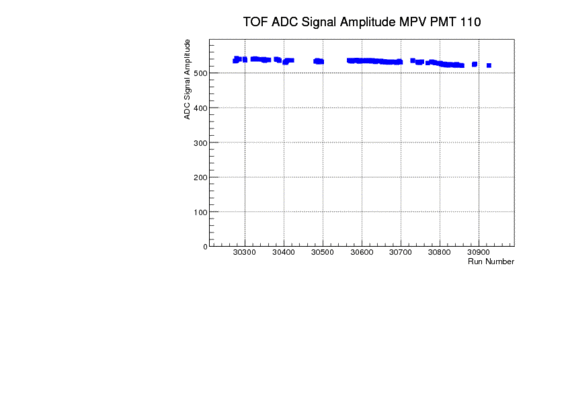
ADC Peak Amplitude during the run period
ADC Peak Amplitude
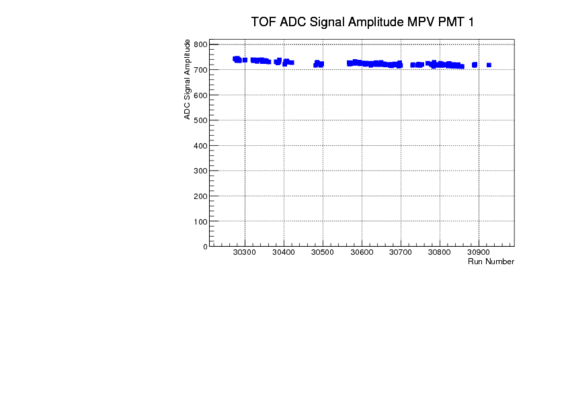
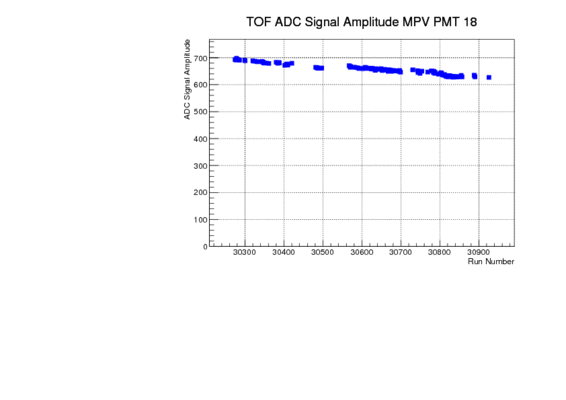
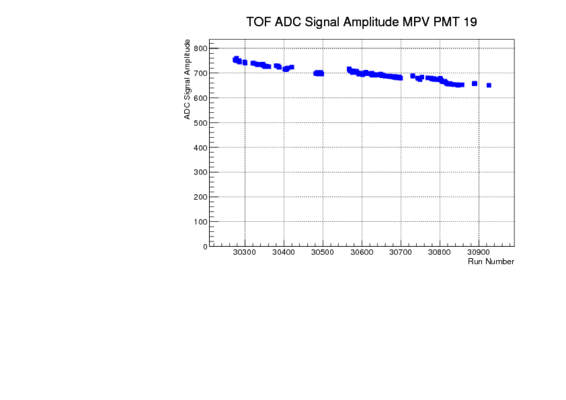
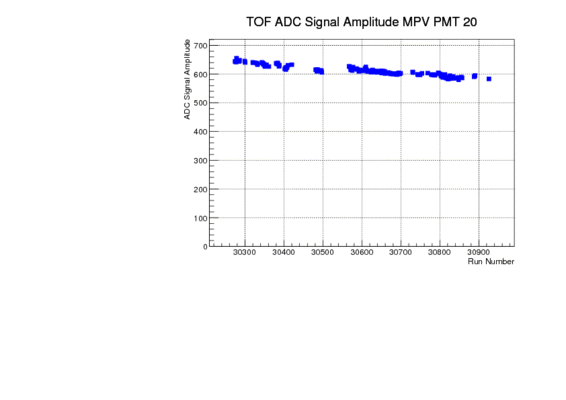
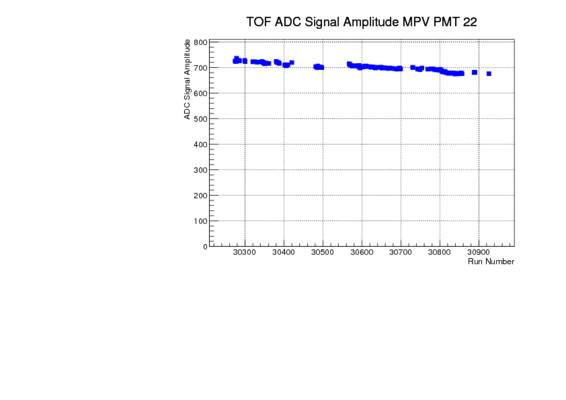
To test the stability of the TOF PMTs over the course of the spring 2017 run we look at the signal amplitudes for hits in the central region of the paddles by selecting events that give a delta t of less than 0.25ns. With an effective light velocity of about 15.5 cm/ns this cut is equivalent to hits within about +/- 4cm of the center of the paddle. The resulting detector response of the PMT signal amplitude is then fit with a Landau function to determine the location of the MPV. This value is then plotted as a function of run number to visualize the behvior of the PMT output over the course of the run period.
Vertical Plane
The first 5 plots show the up-PMTS of paddle 1, 18, 19, 20, 21 and 22 where 1 is the paddle farthest way from the beam line while paddle 21 is the narrow paddles closest to the beam line and paddle 22 is a short paddle.

Horizontal Plane
The following plots show the left PMTs of paddle 18, 19, 20, 21 and 22:
