BCal Beam Test Plots, April 10, 2007
From GlueXWiki
Contents
Cell 7:
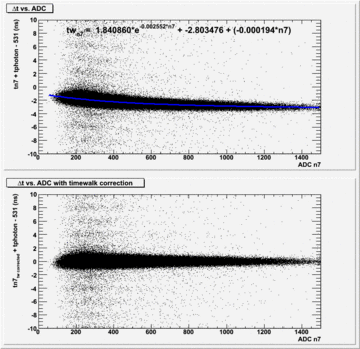
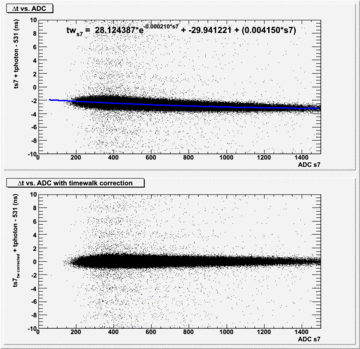
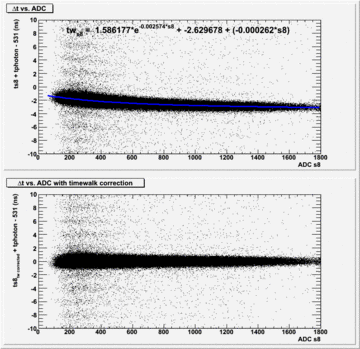
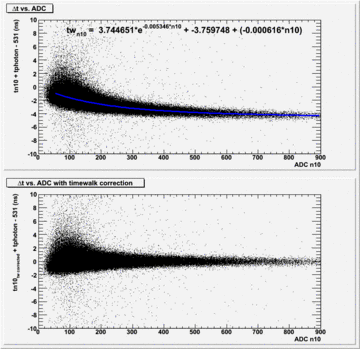
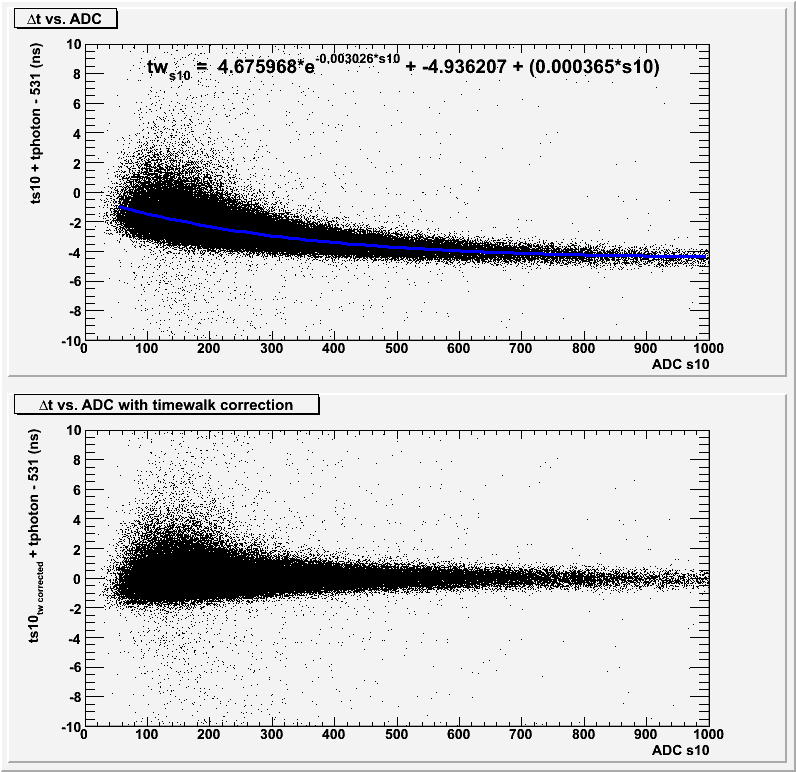
- Walk Corrections
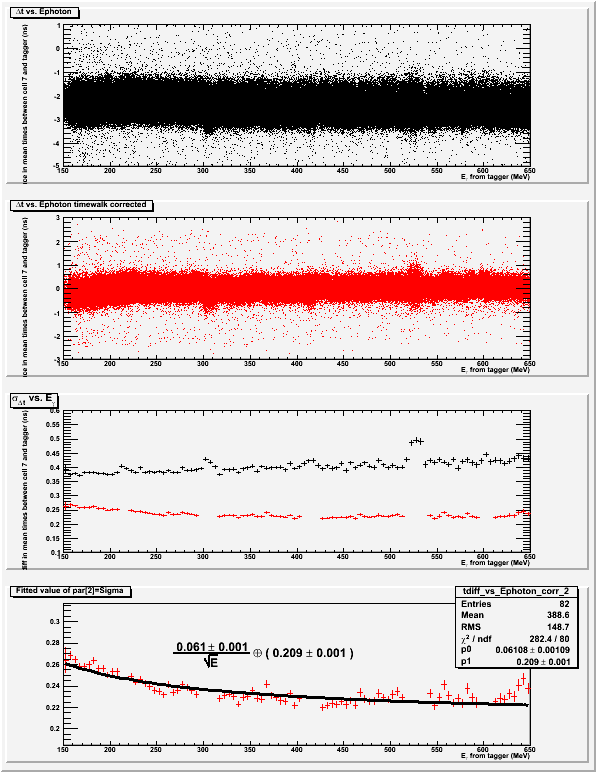
- Time resolution
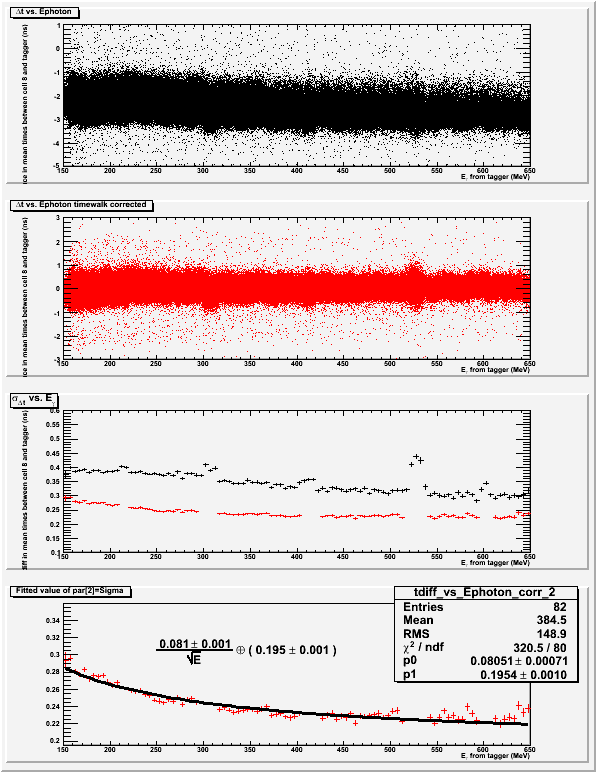
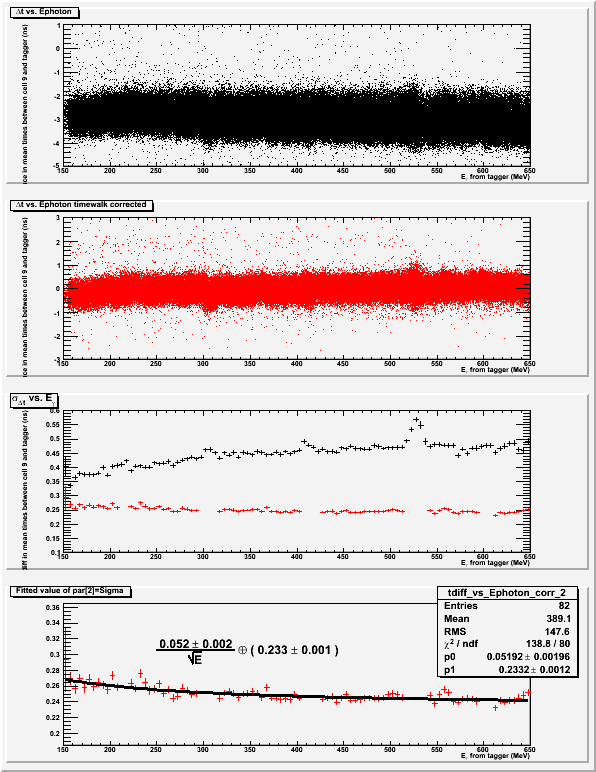
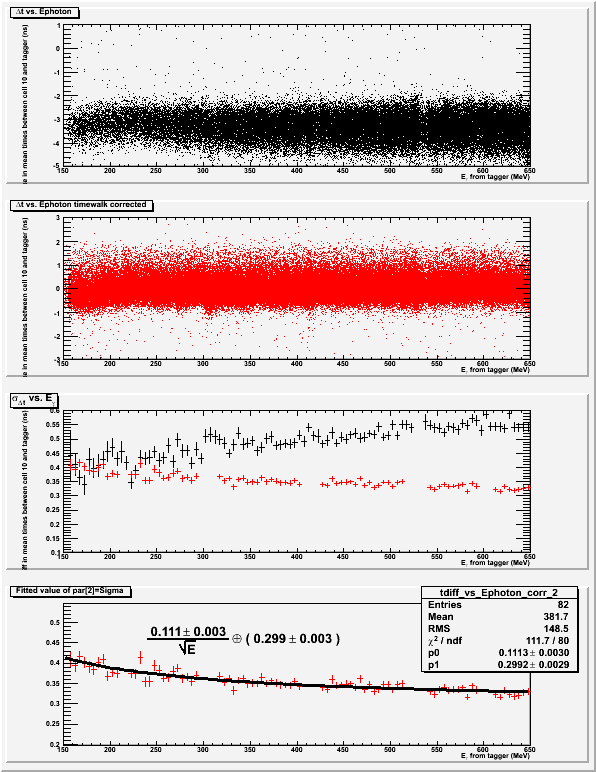
In the 4 plots below (similarly for the other cells), time difference between the mean time of the cell and the tagger is shown as a function of photon energy as reported by the tagger.
(tn8+ts8)/2.0 - (-tphoton) - 531
The top plot (black dots) has no timewalk corrections applied. The 2nd plot (red dots) has the timewalk correction functions applied to each of the tubes. The 3rd plot shows the sigmas resulting from fitting slices of the top 2 histograms to gaussians for each x-bin. This indicates the timing resolution as a function of incident photon energy with(red) and without(black) timewalk corrections applied to each of the TDC signals. The bottom plot is a fit to the 3rd plot(red dots) fitting the function
sqrt( (p0/sqrt(E[GeV]))^2 + (p1)^2 )
Cell 8:
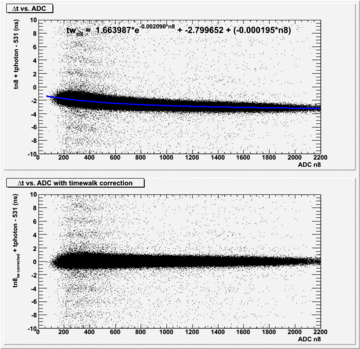
- Time walk
- Time resolution
Cell 9:
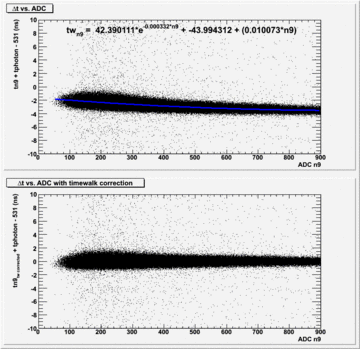
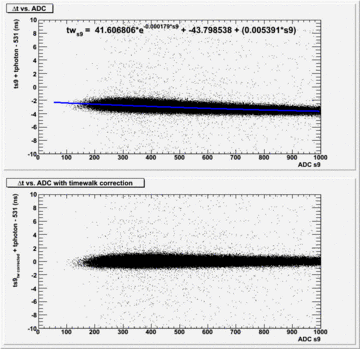
- Time walk
- Time Resolution
Cell 10:
- Time walk
- Time resolution
