BCal Beam Test Plots, April 4, 2007
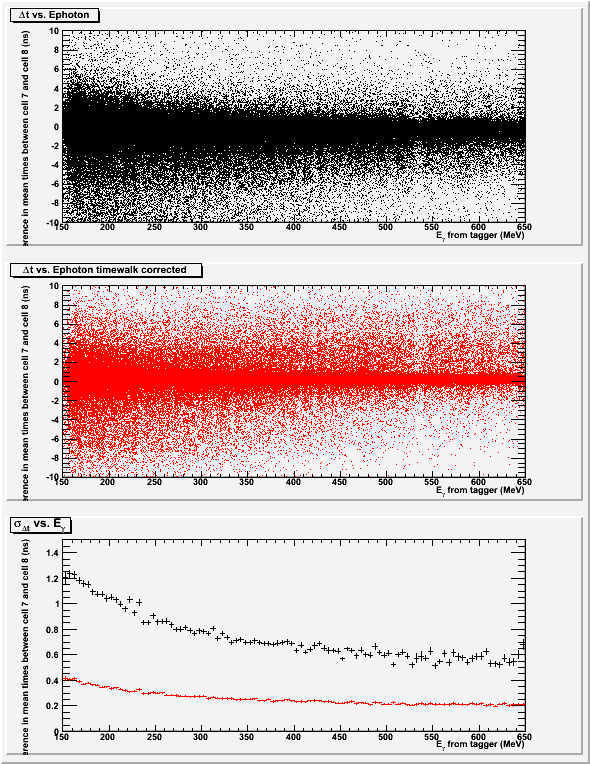
This page describes a study of the timing resolution for the BCAL beam test using run 2440. There was an issue with the data in the DST trees in which it appears the reference time subtracted from the BCAL TDC values was different than that used for the veto TDC values. The evidence for this is that the veto/tagger timing difference(obtained from tveto+tphoton (don't ask)) shows no dependence on T-counter. On the other hand, the BCAL/tagger timing difference shows a clear dependence on the T-counters.
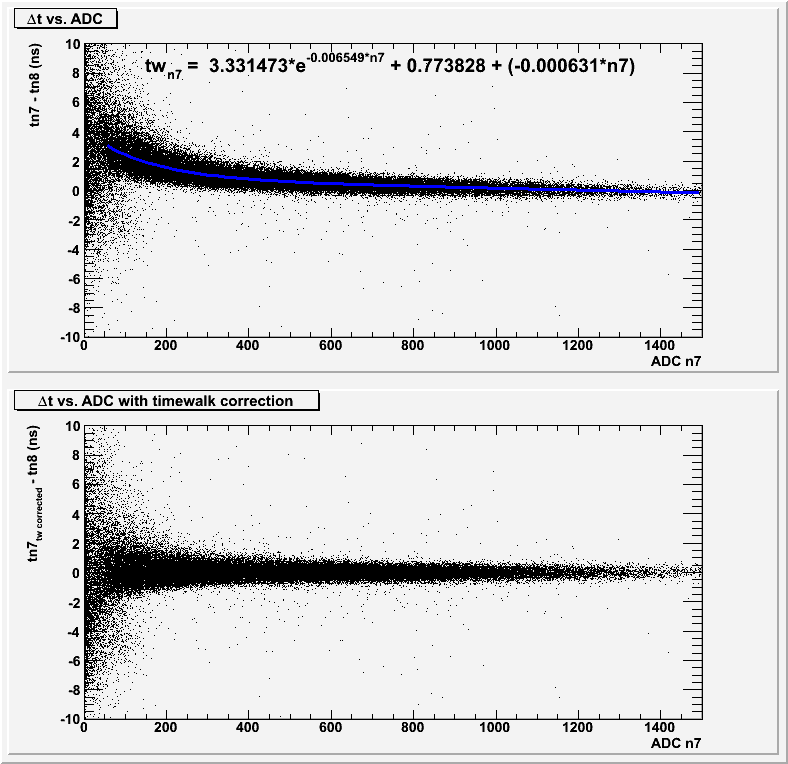
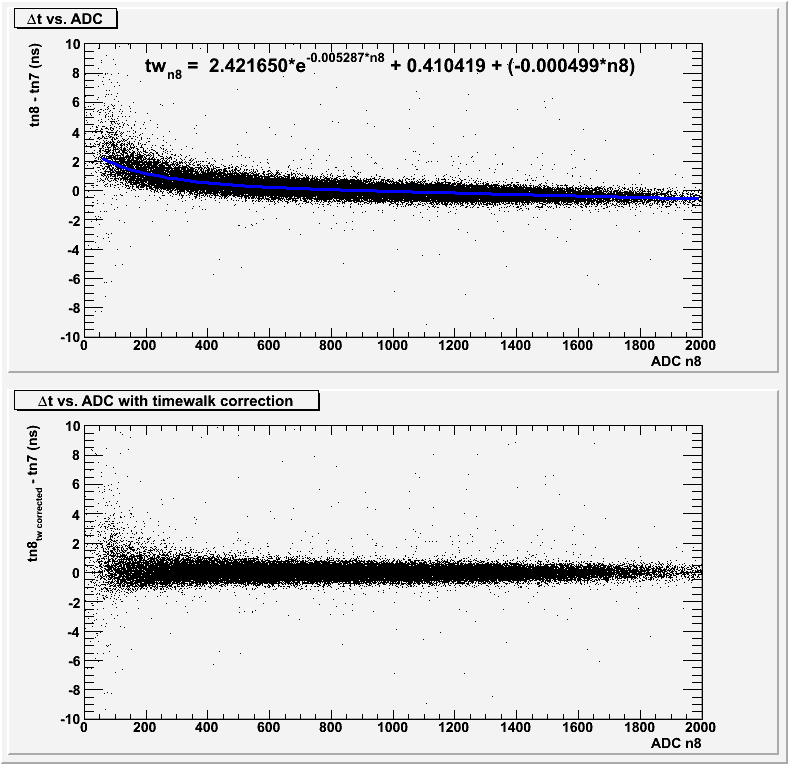
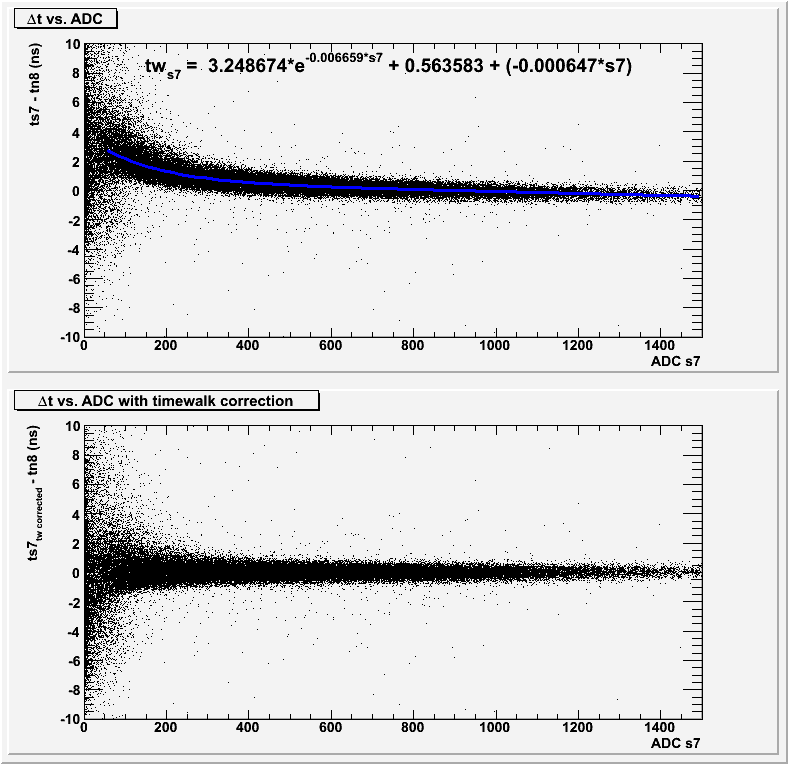
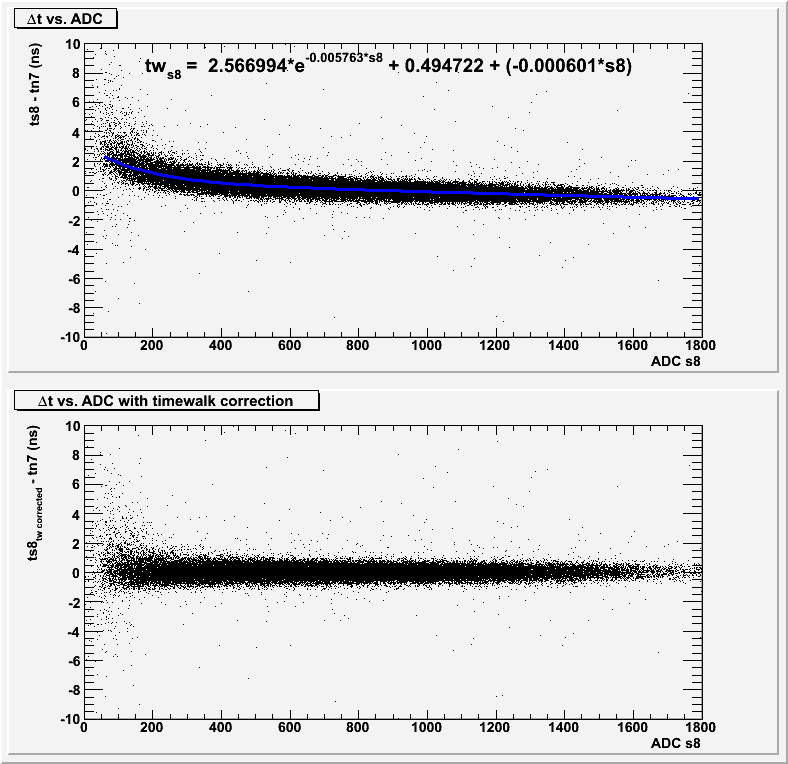
In this study, cells 7 and 8 of the BCAL module are treated as independent detectors. The timing resolution is obtained by looking at the difference in the mean times of these 2 cells. First, however, the timewalk of each of the 4 PMTs involved (n7,n8,s7, and s8) is parameterized so that it can be corrected for.
In the four images that follow(2 plots per image), the top plot shows the difference between a PMT and one from a different cell that is used as the reference. The data in the plot has a cut on the reference channel having a large ADC value so the the timewalk correction coming from there is minimized. The blue curve represents a fit whose form and values are given in the plot. The bottom plot shows the same data, but with the timewalk applied to the channel being calibrated.
