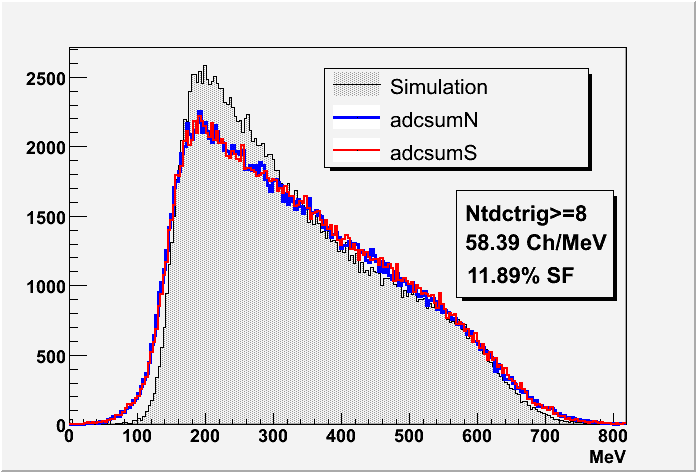
BCal Beam Test Plots, December 15, 2006
From GlueXWiki
The calibrations constants for each ADC were generated by cutting on 400<=Ephoton<600 as there seems to be little or no contamination from the unknown "junk" (probably electrons). The veto information seems quite useless but I cut on tveto<-100 anyway as this removes 0.1% of the garbage. Applying the new calibration one gets the above image which is normalized so that there are an equal number of events under each curve. They do look very similar now but the JLab data is slightly wider "squashed" and extends further into the higher and lower energies presumably due to the lower resolution as the simulation data is idealized where we only have to concern ourselves with the shower fluctuations and the sampling fraction of each shower due to the sampling calorimeter design of the BCal.
- Cutting on Ephoton:


