Difference between revisions of "BCal Beam Test Plots, December 19, 2006"
From GlueXWiki
| Line 1: | Line 1: | ||
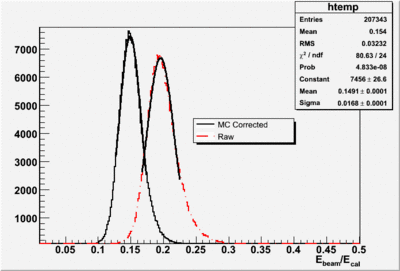
[[Image:Ebeamecal.gif|400px]] | [[Image:Ebeamecal.gif|400px]] | ||
| + | |||
| + | [[Image:Z 200to250.gif|thumb|100px|left]] | ||
| + | [[Image:Z 250to300.gif|thumb|100px|left]] | ||
| + | [[Image:Z 300to350.gif|thumb|100px|left]] | ||
| + | [[Image:Z 350to400.gif|thumb|100px|left]] | ||
| + | [[Image:Z 400to450.gif|thumb|100px|left]] | ||
| + | [[Image:Z 450to500.gif|thumb|100px|left]] | ||
| + | [[Image:Z 500to550.gif|thumb|100px|left]] | ||
| + | [[Image:Z 550to600.gif|thumb|100px|left]] | ||
| + | |||
[[Image:Mean vs Ebeam.gif|400px]] | [[Image:Mean vs Ebeam.gif|400px]] | ||
Revision as of 13:35, 20 December 2006
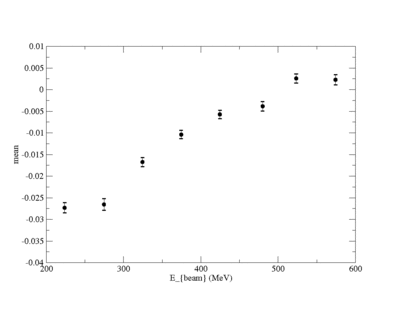
Means vs E_{beam} from Gaussian fits of z from Monte Carlo corrected data
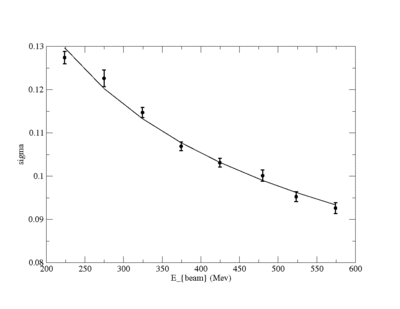
Sigma vs E_{beam} from Gaussian fits of z from Monte Carlo corrected data. The curve is a fit to the function a/sqrt(E[Gev]) + b where and a = 0.046 +/- 0.005 and b = 0.033 +/- 0.005. This is very similar to Alex's note from December 16, 2006 where a = 0.050 and b = 0.020.


