Difference between revisions of "BCal Beam Test Plots, January 3, 2007"
| Line 1: | Line 1: | ||
| + | from previous discussions here are plots of Ntdtrig vs. adcsumN | ||
| + | |||
| + | [[Image:Ntdctrig vs adcsumN.gif|thumb|300px|left]] | ||
| + | <br style="clear:both;"/> | ||
| + | |||
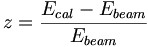
From suggestions from Alex and others I wrote a piece of code that runs in ROOT that plots z finds sigma and then adjusts the PMT gain correction factors until the sigma of the gaussian fit is at it's minimum. Z is defined as | From suggestions from Alex and others I wrote a piece of code that runs in ROOT that plots z finds sigma and then adjusts the PMT gain correction factors until the sigma of the gaussian fit is at it's minimum. Z is defined as | ||
| Line 27: | Line 32: | ||
n18 0.97 s18 1.02 | n18 0.97 s18 1.02 | ||
| − | and the mean of E_beam/E_cal = 0.219. Notice most of the above factors about equal 1 and only n8 | + | and the mean of E_beam/E_cal = 0.219. Notice most of the above factors about equal 1 and only n8 and s8 (and s10) have any significant difference from 1. Coincidence? |
Latest revision as of 14:38, 4 January 2007
from previous discussions here are plots of Ntdtrig vs. adcsumN

From suggestions from Alex and others I wrote a piece of code that runs in ROOT that plots z finds sigma and then adjusts the PMT gain correction factors until the sigma of the gaussian fit is at it's minimum. Z is defined as
You can find the peakfit.C code here. ( in ROOT > .x peakfit.C )
The code goes through and adjusts each gain correction factor by an amount epsilon ( set at 0.01 now) until sigma is minimal. Of course the ADC conversion factor (E_beam/E_cal) has to be calculated each time too. I've run it twice at two different Ephoton binnings to see if there was any drastic difference in the gain factors. There wasn't.
- The gain correction factors come out to be
n1  1.01    s1  1.00
n2  1.00    s2  1.02
n3  1.04    s3  1.02
n4  0.98    s4  0.98
n5  0.98    s5  0.98
n6  0.99    s6  1.01
n7  0.99    s7  0.98
n8  0.79    s8  0.68
n9  1.04    s9  1.04
n10 0.99    s10 1.11
n11 1.03    s11 0.97
n12 1.00    s12 1.05
n13 1.04    s13 0.99
n14 0.93    s14 1.04
n15 0.92    s15 0.99
n16 1.03    s16 1.04
n17 1.03    s17 1.03
n18 0.97    s18 1.02
and the mean of E_beam/E_cal = 0.219. Notice most of the above factors about equal 1 and only n8 and s8 (and s10) have any significant difference from 1. Coincidence?
Doing this shows a good improvement in the "floor term" and the energy dependent term is still approximately 5%. The fit is using 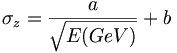 in the package xmgrace.
