Difference between revisions of "CDC Backgrounds"
From GlueXWiki
(→Items for Discussion) |
(→Plots) |
||
| Line 24: | Line 24: | ||
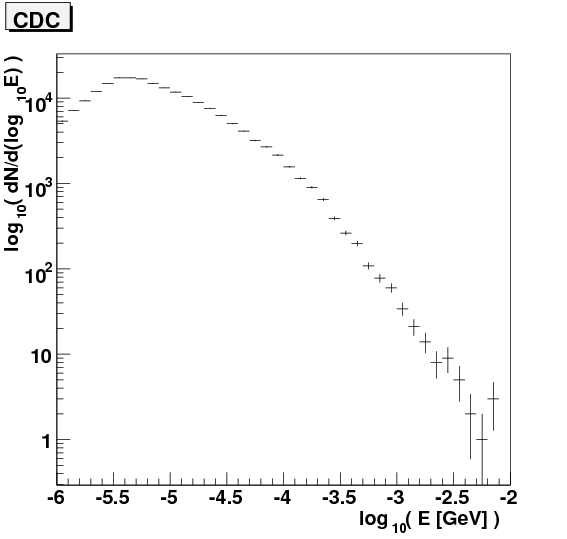
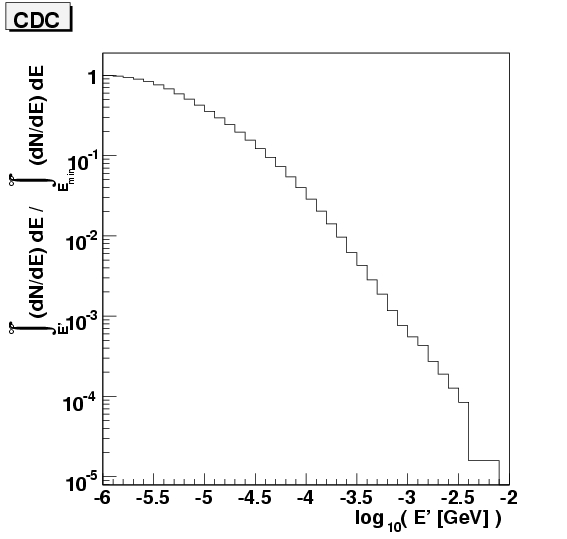
[[Image:cdc_energy_int.jpg|frame|center|The integral of the energy spectrum above. Plotted on the y axis is the fraction of the spectrum above the corresponding x axis cutoff.]] | [[Image:cdc_energy_int.jpg|frame|center|The integral of the energy spectrum above. Plotted on the y axis is the fraction of the spectrum above the corresponding x axis cutoff.]] | ||
| + | |||
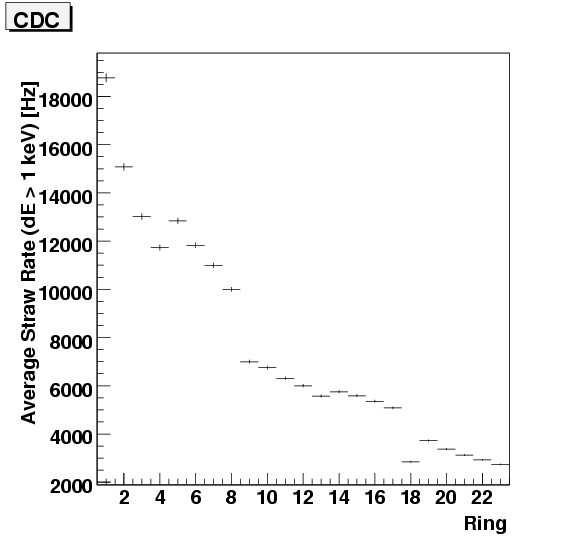
| + | [[Image:Rings_nowt.gif|frame|center|A repeat of the calculation by Matt (see top figure above) showing the background rates in the CDC straws versus ring number at nominal GlueX running intensity of <math>10^8</math> tags/s. This plot shows the same enhanced rates in the stereo layers as was observed by Matt.]] | ||
| + | |||
| + | [[Image:Rings_wt.gif|frame|center|The same CDC hit data as shown in the above plot, but weighted this time by the energy of the hit. If the stereo layer enhancement just comes from tracks moving along the field lines going through several stereo straws then the stereo layers should not stand out in this plot. They do not, so the enhancement can be understood in this way.]] | ||
Revision as of 14:59, 24 January 2007
Back to Background Rate Studies
Detector Configuration
- Double-Hit Resolution: 250 ns
- Threshold: 1 keV
- Maximum Number of Hits (per Event): 100
Items for Discussion
- Should stereo geometry be so noticeable in background rate? If the noise source is far upstream, then stereo straws will present a large cross section to the noise source than axial straws.
You can check this by plotting the total energy deposition per straw vs layer number, instead of the hit rate. If the enhancement in the stereo layers is just due to background tracks running along the field lines then it should disappear in the energy plot, because the same energy is just concentrated in fewer straws in the straight layers than in the stereo ones. I have looked at a small sample, and the stereo layers seem to line up with the others, but I need more statistics to be sure. I am running a larger sample now.[rtj]
- There seems to be something wrong with CDC layer 18. Is this just a bug in the geometry or something else?
This was a bug in the hdds geometry, due to a typographical error in the xml source document. The fix has been checked into the central repository. [rtj]
Plots
File:Rings nowt.gif
A repeat of the calculation by Matt (see top figure above) showing the background rates in the CDC straws versus ring number at nominal GlueX running intensity of  tags/s. This plot shows the same enhanced rates in the stereo layers as was observed by Matt.
 tags/s. This plot shows the same enhanced rates in the stereo layers as was observed by Matt.
File:Rings wt.gif
The same CDC hit data as shown in the above plot, but weighted this time by the energy of the hit. If the stereo layer enhancement just comes from tracks moving along the field lines going through several stereo straws then the stereo layers should not stand out in this plot. They do not, so the enhancement can be understood in this way.


