Difference between revisions of "CDC Pedestal Studies"
From GlueXWiki
| Line 9: | Line 9: | ||
In the case of no signal the the distribution D is expected to be around zero with a sigma that reflects the resolution and depends on the number | In the case of no signal the the distribution D is expected to be around zero with a sigma that reflects the resolution and depends on the number | ||
samples <math>N_{i}</math> used in determining the pedestal. | samples <math>N_{i}</math> used in determining the pedestal. | ||
| + | {| class="wikitable" | ||
| + | |- | ||
| + | ! <math>N_{i}</math> !! mean F !! sigma F !! mean I !! sigma I | ||
| + | |- | ||
| + | | 4 || 102.2 || 1293 || 96.5 || 1276 | ||
| + | |- | ||
| + | | 16 || 119.0 || 1121 || 163.4 || 1120 | ||
| + | |- | ||
| + | | 20 || 121.1 || 1080 || 145.1 || 1080 | ||
| + | |- | ||
| + | | 32 || 102.4 || 984 || 159.0 || 978 | ||
| + | |- | ||
| + | | 64 || 40.9 || 680 || 84.6 || 685 | ||
| + | |} | ||
Revision as of 16:20, 23 June 2015
Pedestal Subtraction
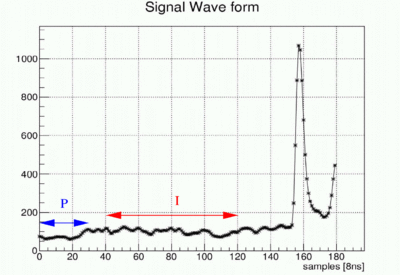
Based on cosmic ray data with BCAL trigger Look for events with the following signature in the CDC:
The first test was done by using the region  (blue) to determine a pedestal and the region I (red) to determine an Integral and then subtract the proper pedestal from the Intergral as follows:
 where
where  is the number of samples used to calculate the pedestal and 80 is the number of samples in the Integral I.
In the case of no signal the the distribution D is expected to be around zero with a sigma that reflects the resolution and depends on the number
samples
  used in determining the pedestal.
 |
mean F | sigma F | mean I | sigma I |
|---|---|---|---|---|
| 4 | 102.2 | 1293 | 96.5 | 1276 |
| 16 | 119.0 | 1121 | 163.4 | 1120 |
| 20 | 121.1 | 1080 | 145.1 | 1080 |
| 32 | 102.4 | 984 | 159.0 | 978 |
| 64 | 40.9 | 680 | 84.6 | 685 |
