Difference between revisions of "CDC gain calibrations"
From GlueXWiki
| Line 5: | Line 5: | ||
{| border="0" cellpadding="2" | {| border="0" cellpadding="2" | ||
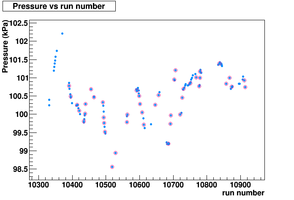
| − | |[[Image:cdc_calib3_pressure.png|thumb|x200px|pressure during runs 10331-10913]] | + | |[[Image:cdc_calib3_pressure.png|thumb|x200px|pressure during runs 10331-10913. Circled runs selected for calibration.]] |
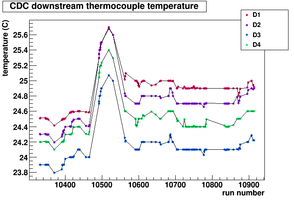
|[[Image:cdc_calib3_temp.png|thumb|x200px|temperature during runs 10391-10913]] | |[[Image:cdc_calib3_temp.png|thumb|x200px|temperature during runs 10391-10913]] | ||
|} | |} | ||
Revision as of 13:09, 24 June 2016
Early runs 10391-10913
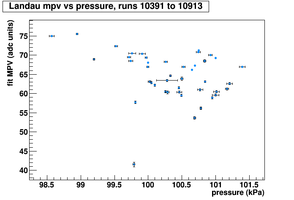
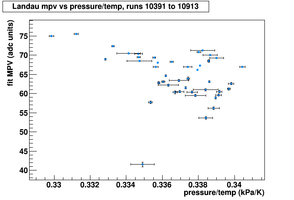
- fadc thresholds were high and for runs with high atmospheric pressure the minimum ionizing peak in pulse amplitude was partly or mostly below threshold
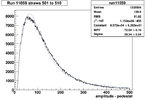
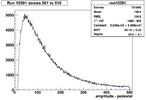
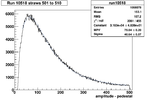
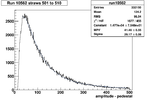
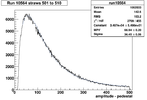
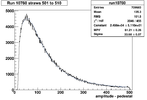
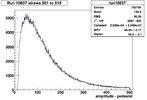
- Chose straws 501-510 as these had high gain and their MIP was visible in most runs, found the scaling factor to match their MPV for the run of interest to run 11059, scaled the individual gains for run 11059 to give gains for the run of interest. Chose run 11059 as it was the next run after the thresholds had been adjusted.
