Difference between revisions of "CDC prototype more drift times"
| Line 1: | Line 1: | ||
| − | |||
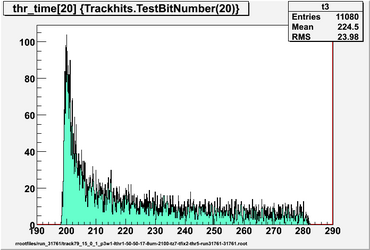
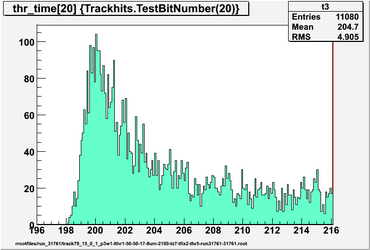
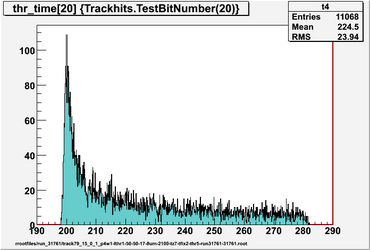
Drift time histograms for various local pedestal points | Drift time histograms for various local pedestal points | ||
<br> | <br> | ||
| Line 17: | Line 16: | ||
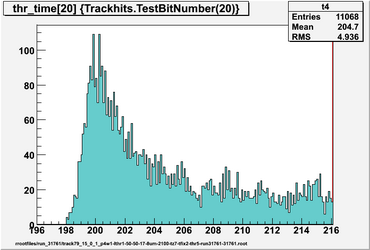
|[[Image:run_31761_p2w1_thrtime20.png|thumb|x250px|1-sigma threshold time]] | |[[Image:run_31761_p2w1_thrtime20.png|thumb|x250px|1-sigma threshold time]] | ||
|[[Image:run_31761_p2w1_thrtime20z.png|thumb|x250px|1-sigma threshold time]] | |[[Image:run_31761_p2w1_thrtime20z.png|thumb|x250px|1-sigma threshold time]] | ||
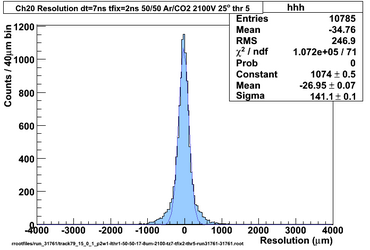
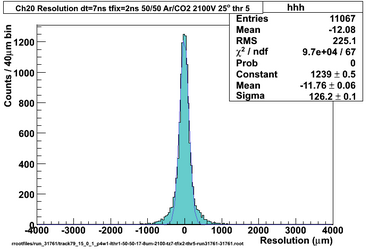
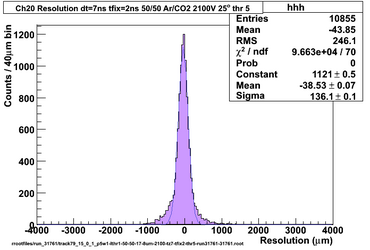
| + | |[[Image:run_31761_p2w1_res20.png|thumb|x250px|Ch20 resolution]] | ||
|} | |} | ||
| Line 24: | Line 24: | ||
|[[Image:run_31761_p3w1_thrtime20.png|thumb|x250px|1-sigma threshold time]] | |[[Image:run_31761_p3w1_thrtime20.png|thumb|x250px|1-sigma threshold time]] | ||
|[[Image:run_31761_p3w1_thrtime20z.png|thumb|x250px|1-sigma threshold time]] | |[[Image:run_31761_p3w1_thrtime20z.png|thumb|x250px|1-sigma threshold time]] | ||
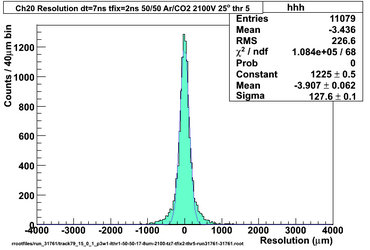
| + | |[[Image:run_31761_p3w1_res20.png|thumb|x250px|Ch20 resolution]] | ||
|} | |} | ||
| Line 31: | Line 32: | ||
|[[Image:run_31761_p4w1_thrtime20.png|thumb|x250px|1-sigma threshold time]] | |[[Image:run_31761_p4w1_thrtime20.png|thumb|x250px|1-sigma threshold time]] | ||
|[[Image:run_31761_p4w1_thrtime20z.png|thumb|x250px|1-sigma threshold time]] | |[[Image:run_31761_p4w1_thrtime20z.png|thumb|x250px|1-sigma threshold time]] | ||
| + | |[[Image:run_31761_p4w1_res20.png|thumb|x250px|Ch20 resolution]] | ||
|} | |} | ||
| Line 38: | Line 40: | ||
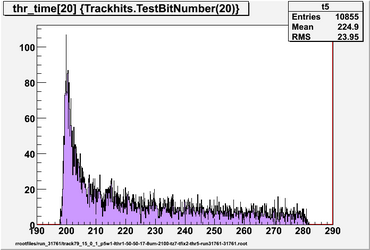
|[[Image:run_31761_p5w1_thrtime20.png|thumb|x250px|1-sigma threshold time]] | |[[Image:run_31761_p5w1_thrtime20.png|thumb|x250px|1-sigma threshold time]] | ||
|[[Image:run_31761_p5w1_thrtime20z.png|thumb|x250px|1-sigma threshold time]] | |[[Image:run_31761_p5w1_thrtime20z.png|thumb|x250px|1-sigma threshold time]] | ||
| + | |[[Image:run_31761_p5w1_res20.png|thumb|x250px|Ch20 resolution]] | ||
|} | |} | ||
| + | <br> | ||
| + | <span style="font-size:small, color:#ffa">851,836,426,871</span> | ||
| + | <br> | ||
Revision as of 09:48, 8 March 2012
Drift time histograms for various local pedestal points
The pedestal lead time is the # samples before the hit threshold crossing where the pedestal window ends. Usually I used 3 samples with a pedestal window 1 sample (ie the pedestal value is equal to the fADC value 3 samples before the hit threshold is exceeded). Some experimenting showed that the best points to use for a 5-sigma hit threshold are a window of 1 or 2 samples, ending 3 bins before the hit threshold crossing.
Also see CDC_prototype_more_on_timing
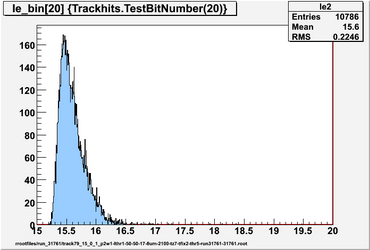
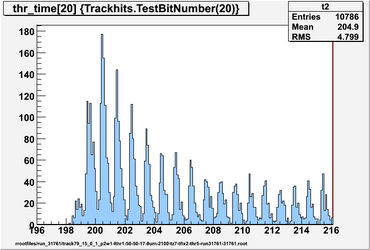
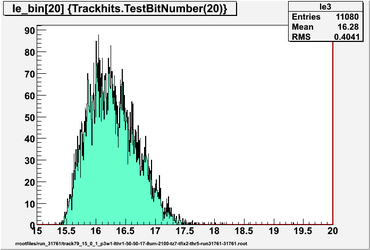
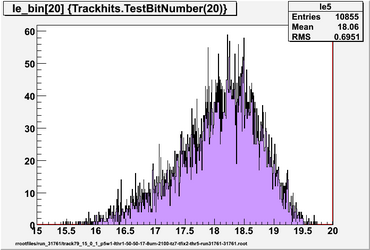
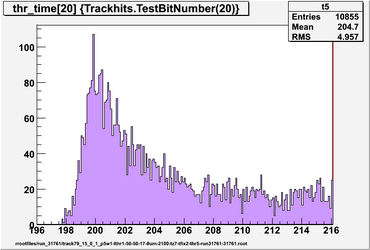
Le_bin is the timing threshold crossing in fADC samples (8ns each) and it is relative to the hit threshold crossing time. Le_bin=0 corresponds to (15 + pedestal lead) samples before the hit threshold crossing bin. ie the drift time in bins is hit threshold crossing bin - 15 - pedestal_lead_time + le_bin. The sample values sent to the upsampling algorithm start at le_bin=0. 20 + pedestal_lead_time values are used so the upsampling data end 5 samples after the hit threshold crossing bin.
851,836,426,871
