Difference between revisions of "CDC prototype more on timing"
From GlueXWiki
| Line 23: | Line 23: | ||
|width="450pt"| | |width="450pt"| | ||
[[Image:run_31716_track54_le2_p5_thr5_z20.png|thumb|450px|p=5]] | [[Image:run_31716_track54_le2_p5_thr5_z20.png|thumb|450px|p=5]] | ||
| + | |} | ||
| + | High threshold 6 sigma | ||
| + | {| border="0" cellpadding="2" | ||
| + | |width="450pt"| | ||
| + | [[Image:run_31716_track54_le2_p2_thr6_z20.png|thumb|450px|6 sigma, p=2]] | ||
| + | |width="450pt"| | ||
| + | [[Image:run_31716_track54_le2_p3_thr6_z20.png|thumb|450px|6 sigma, p=3]] | ||
|} | |} | ||
Revision as of 11:52, 21 October 2011
Current analysis code procedure:
- Calculate s.d. of pedestal for first 100 samples, 100 events, save for later use (sigma)
For each event...
- Calculate mean pedestal over 100 samples ending 10 samples before the trigger time (every 4th of these samples also works)
- Search forward for sample x where adc value > high threshold n1 sigma
- Step back p samples to sample p-x, take adc value of sample p-x to be local pedestal value
- Subtract local pedestal value from a number (10+p) of samples starting at sample x-(p+5) to the LE algo for interpolation
- Search through interpolated samples, start with last sample (highest adc value) search backwards until adc value < low threshold n2 sigma
- Calculate time where interpolated samples cross n2 sigma, and add to time of sample p-x, this is the estimated drift time.
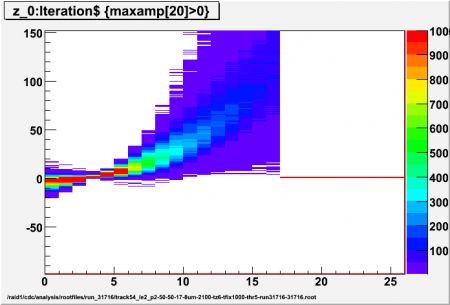
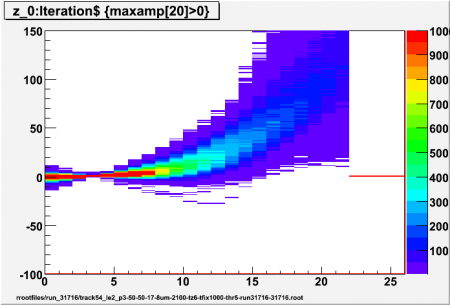
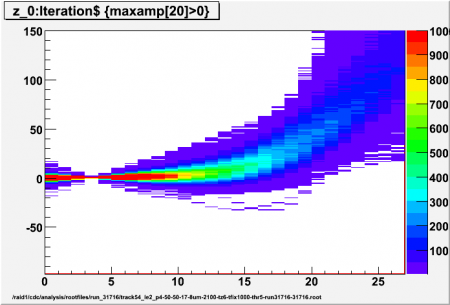
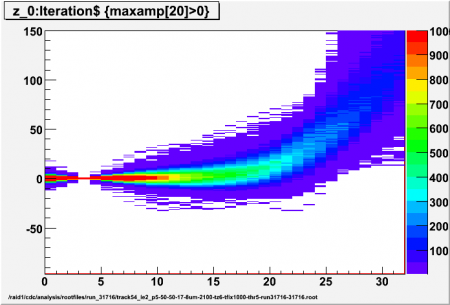
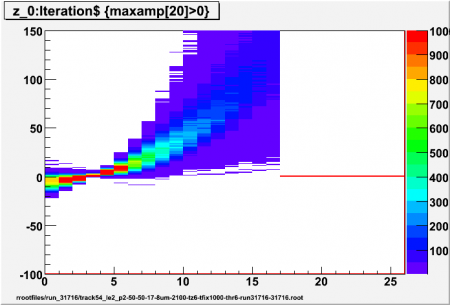
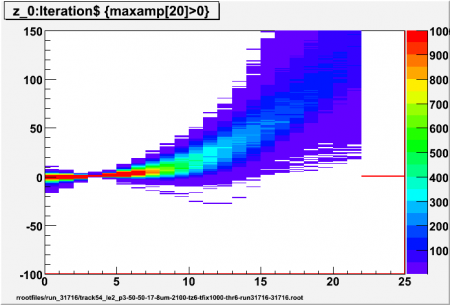
Interpolated adc values (z) using different values for p (local pedestal lead time ahead of first/high threshold crossing) for high threshold of 5 sigma. Sample p-x has z=0, 5 interpolated values per sample, all events for ch17 (central straw) included (no tracking)
High threshold 6 sigma
