Difference between revisions of "CDC time spikes"
| Line 69: | Line 69: | ||
(the histos in each image (set of plots) are arranged as in the prototype but the sets of plots are not). | (the histos in each image (set of plots) are arranged as in the prototype but the sets of plots are not). | ||
{| border="0" cellpadding="2" | {| border="0" cellpadding="2" | ||
| − | |[[Image:run_31960_xthr_p50_2d_9.png|thumb| | + | |[[Image:run_31960_xthr_p50_2d_9.png|thumb|x250px|straw 9 ]] |
| − | |[[Image:run_31960_xthr_p50_2d_1.png|thumb| | + | |[[Image:run_31960_xthr_p50_2d_1.png|thumb|x250px|straw 1 ]] |
| − | |[[Image:run_31960_xthr_p50_2d_0.png|thumb| | + | |[[Image:run_31960_xthr_p50_2d_0.png|thumb|x250px|straw 0 ]] |
| − | |[[Image:run_31960_xthr_p50_2d_8.png|thumb| | + | |[[Image:run_31960_xthr_p50_2d_8.png|thumb|x250px|straw 8 ]] |
|} | |} | ||
Revision as of 11:49, 19 November 2012
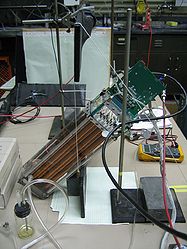
Prototype at 2100V, 50/50 Ar/CO2
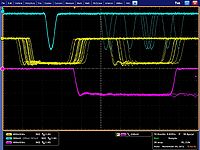
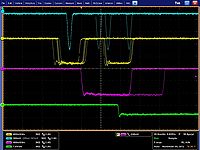
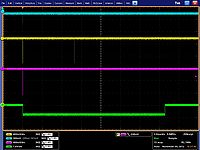
Trigger signals
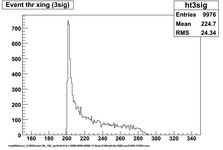
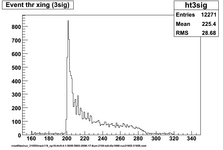
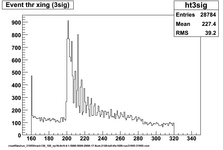
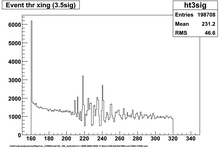
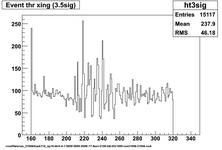
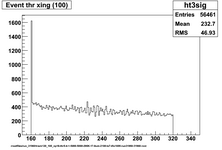
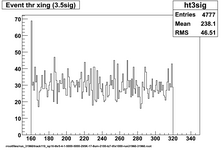
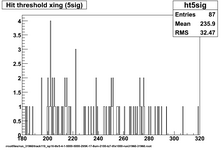
Histograms of threshold-crossing bins in central bank of 16 straws, different thresholds (ignore the histo titles)
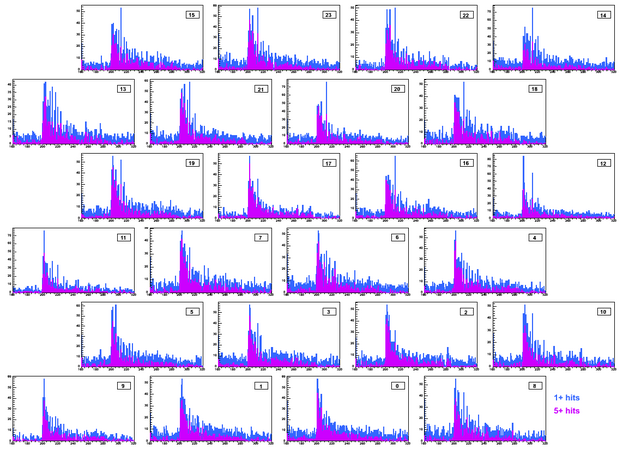
Histograms of ADC value=100 threshold-crossing bins in individual straws (search started at bin 160)
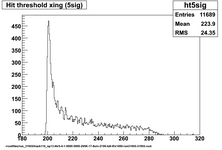
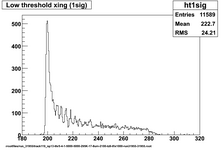
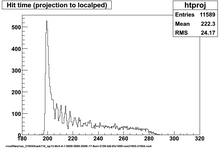
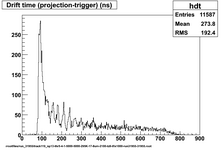
Same data after more normal analysis (Search forward to find pedestal+5sigma crossing, then backwards to find 4sigma and then 1sigma crossings)
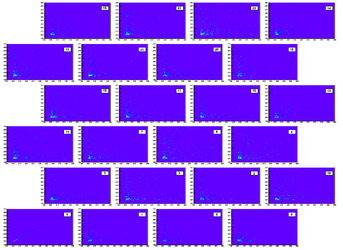
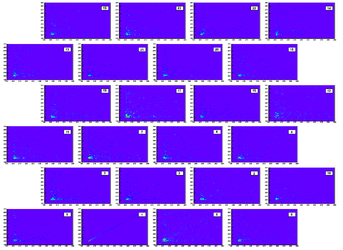
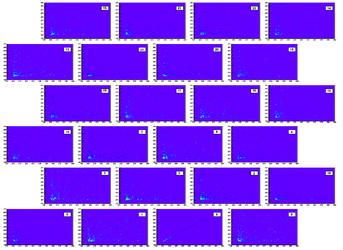
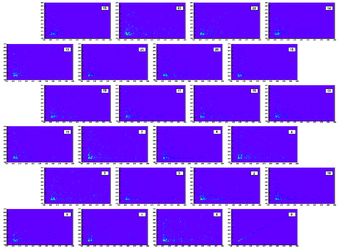
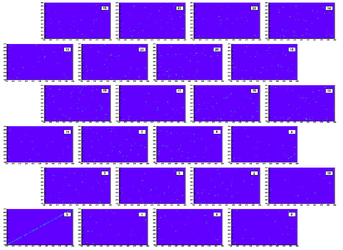
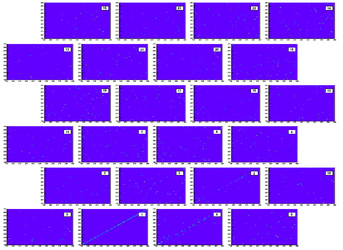
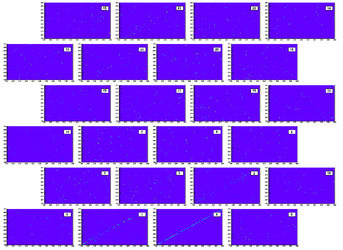
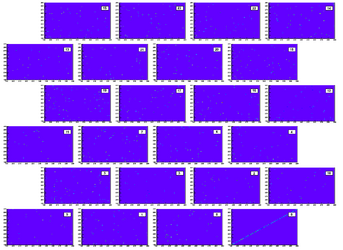
2-d histograms of ADC value=mean pedestal+50 (= c. 105 to 110) threshold-crossing bins in each straw vs same for one particular straw
Data are plotted for events with non-zero threshold-crossing in both straws.
The histos in each image (set of plots) are arranged as in the prototype, these are the images for the bottom row of straws.
Noise run (triggered on 20us pulser) ADC=100 crossing bins
Noise run (triggered on scintillator when prototype was not above/beneath it) ADC=100 crossing bins
Noise run (triggered on scintillator when prototype was not above/beneath it) ADC=100 crossing bins 2-d histograms of ADC value=100 threshold-crossing bins in each straw vs same for one particular straw Data are plotted for events with non-zero threshold-crossing in both straws. (the histos in each image (set of plots) are arranged as in the prototype but the sets of plots are not).
