CHESS X-ray measurements 11/2006
In November, we had a one week beamtime at CHESS in Cornell University. We measured rocking curve for several diamond crystal there. Some interesting results are shown as follow.
A contour map of rocking curve width for the 20 micron thick diamond crystal (diffraction plane: (-2 2 0)): 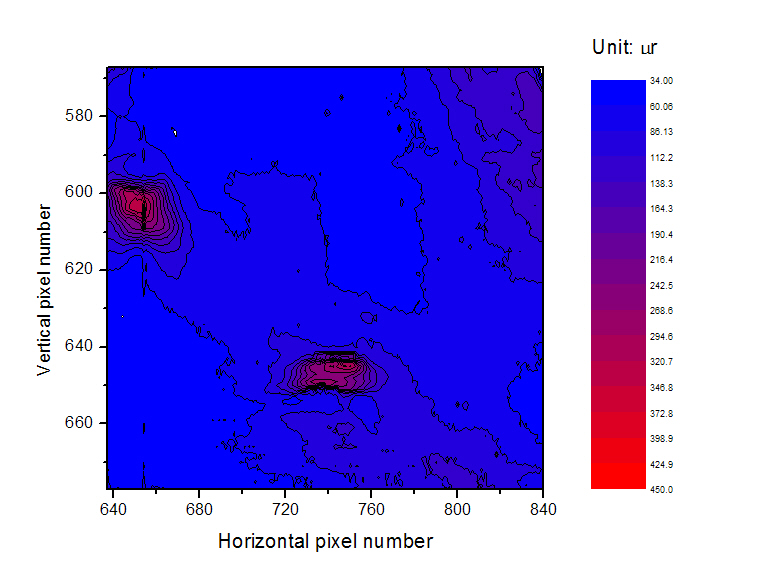 .
.
A rocking curve width map for the 20 micron crystal (Diffraction plane :( 2 2 0)): 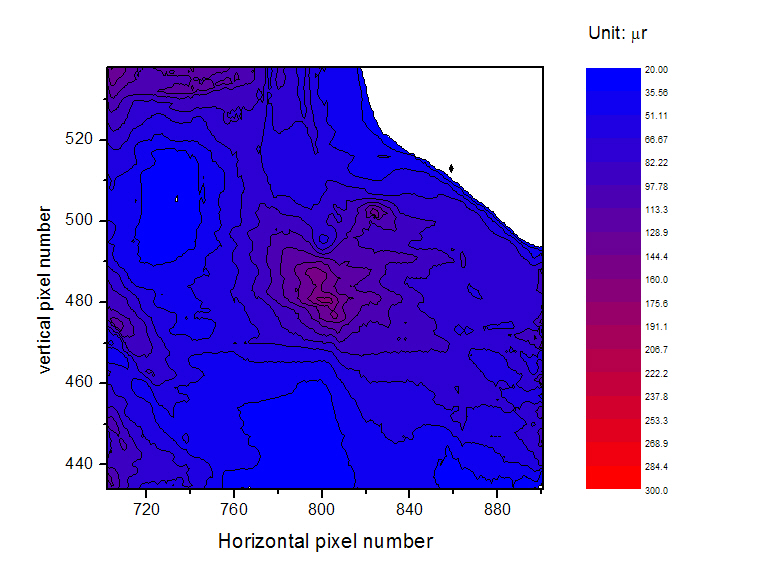 .
.
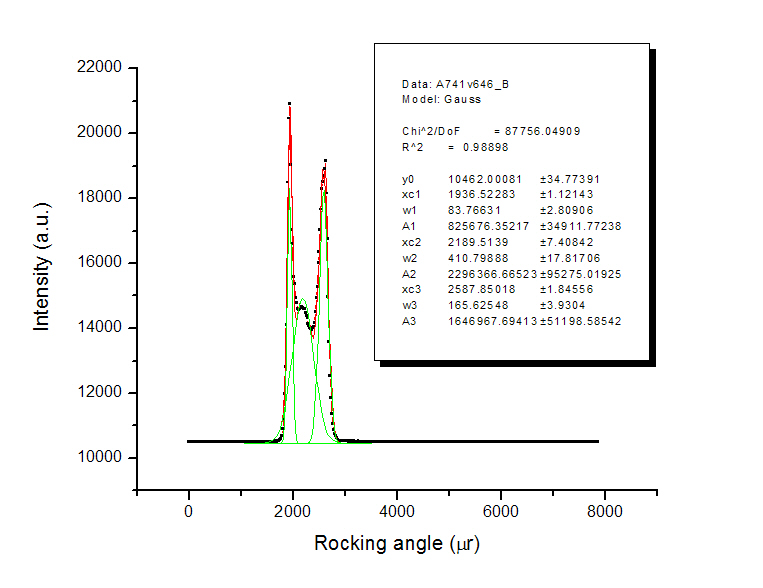
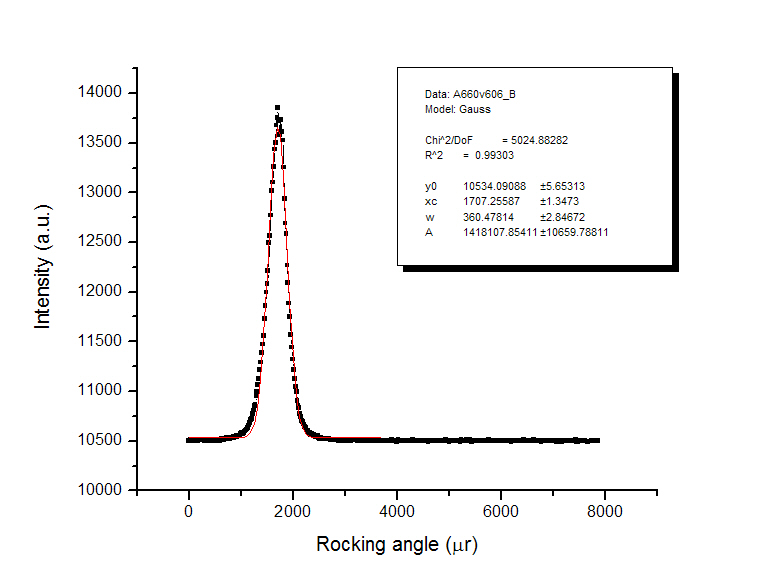
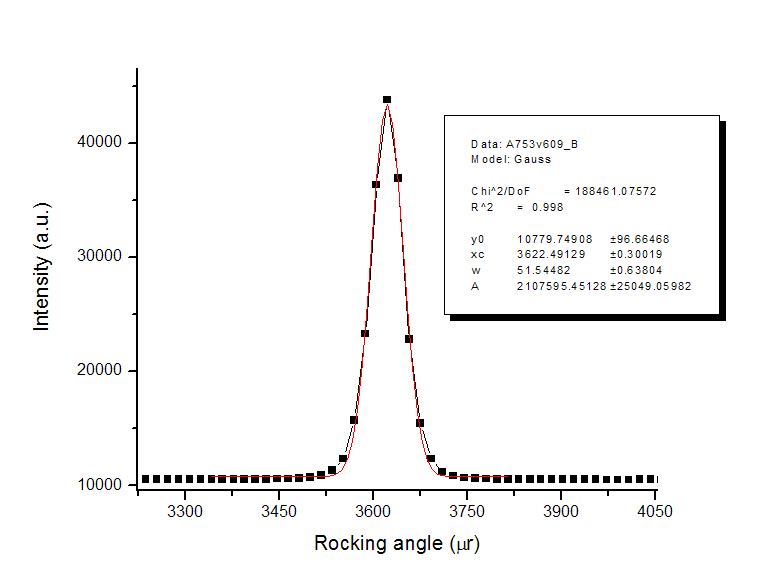
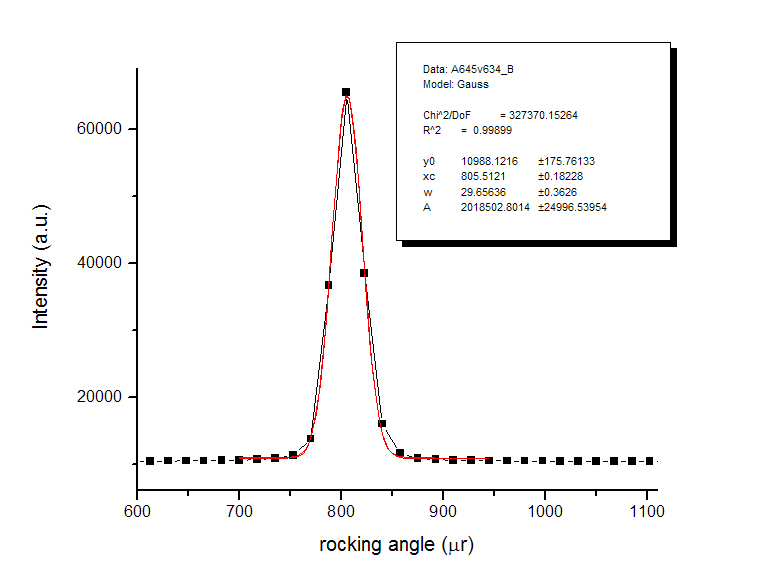
Rocking curves for isolated pixels of the CCD camera used at some interesting locations.
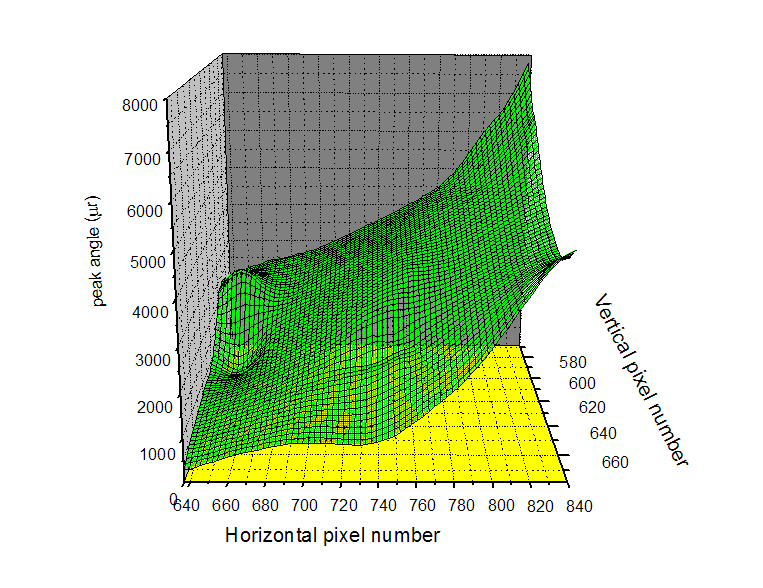
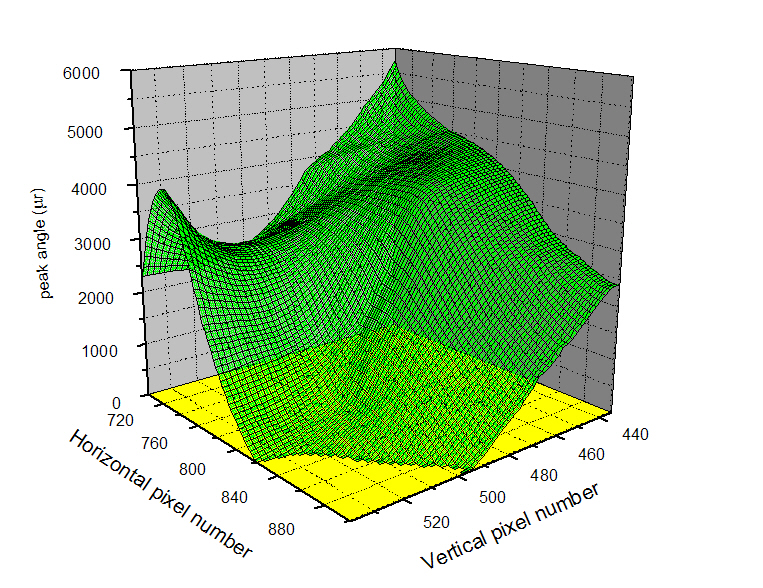
The minimum measured rocking curve width for the 20 micron diamond is around 30 \micron r. The measured rocking curve width is broader than the true rocking curve with of the diamond crystal due to the instrumental broadening. The main source of the instrumental broadening is the x ray beam divergence. For an isolated pixel, the beam divergence is ~ 15 micro radians. We used a (+,-) crystal set-up for the monochromator crystal and the diamond crystal. Since the diffraction angles are different, this setting is not truly non dispersive. The additional rocking curve width from dispersion is ~ 9 micro radians. Taking the above 2 contributions into account, the diamond rocking curve width should be less than ~24 micro radians. Another possible reason for the rocking curve broadening is the curvature of the diamond crystal. The adhesives used for mounting and the marks on the crystal surfaces are the possible sources that could introduce stress to the crystal and the crystal are deformed by stress. If the crystal diffraction plane is all the same at different crystal locations, the measured rocking curve should have the same rocking curve peak position (if the d spacing is all the same for different positions). The rocking curve peak positions recorded by different pixels of the camera are quiet different, this means the 20 micron diamond crystal is severally deformed by stress.
The following are 2 graphs showing the rocking curve peak positions varying with pixel positions.
