Difference between revisions of "F125ADC Tests with FDC"
From GlueXWiki
| Line 6: | Line 6: | ||
[[Image:drift_time_wire17_no_interplation.gif|420px|Drift time wire 17, No interpolation]] | [[Image:drift_time_wire17_no_interplation.gif|420px|Drift time wire 17, No interpolation]] | ||
[[Image:drift_time_wire17_with_interplation.gif|420px|Drift time wire 17, No interpolation]] | [[Image:drift_time_wire17_with_interplation.gif|420px|Drift time wire 17, No interpolation]] | ||
| + | <br> <br> | ||
| + | For the same wire we can calculate the time difference between this wire and the strips. This is shown in the following: | ||
| + | |||
| + | [[Image:wire17_timediff_to_strips.gif|420px|Time difference of wire 17 with the top and bottom strips]] | ||
Revision as of 15:32, 20 May 2011
In the following data are shown using an f125ADC with the first 24 channels connected to wires the second 24 channels connected to top cathode strips and the last 24 channels to bottom cathode strips.
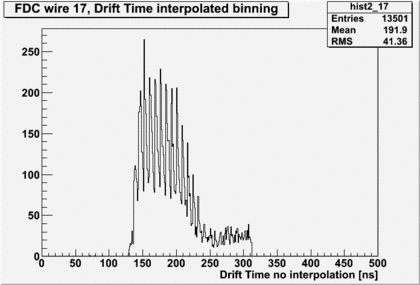
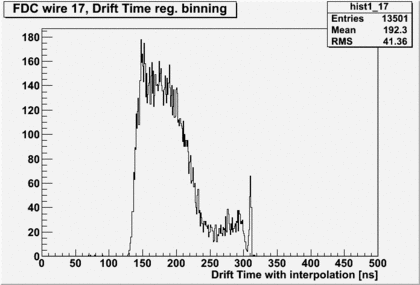
First we look at the drift time spectrum of the wires. As an example we take wire 17 where the first plot is without interpolation and the
second plot is with interpolation to determine when the signal passes the threshold.


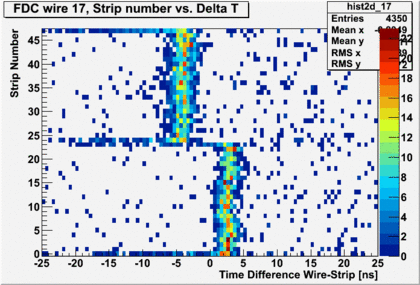
For the same wire we can calculate the time difference between this wire and the strips. This is shown in the following:
