Difference between revisions of "February 17, 2009 Physics"
From GlueXWiki
| Line 14: | Line 14: | ||
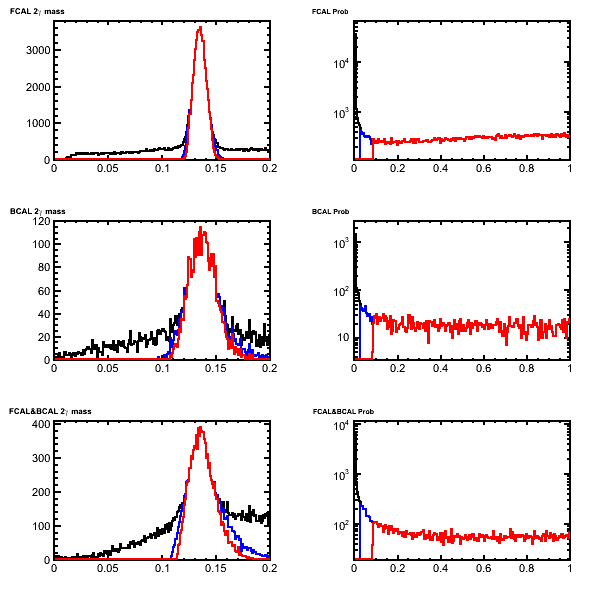
| − | * Unconstrained invariant mass (left) and fit confidence level (right) for '''pi0''' candidates after the mass-constrained kinematic fit. Candidates with Chi2 < 3(5) are shown in red (blue). This can be compared with Figure 5.12 in | + | * Unconstrained invariant mass (left) and fit confidence level (right) for '''pi0''' candidates after the mass-constrained kinematic fit. Candidates with Chi2 < 3(5) are shown in red (blue). These are from decays of a2(1320)to eta-pi0 to 4 gamma generated in genr8. This can be compared with Figure 5.12 in [http://argus.phys.uregina.ca/gluex/DocDB/0009/000989/001/simulation.pdf Calorimeter physics simulations and reconstruction for the Calorimetry Review (GlueX Portal)] |
| − | + | ||
[[Image:Figure512.png]] | [[Image:Figure512.png]] | ||
| Line 21: | Line 20: | ||
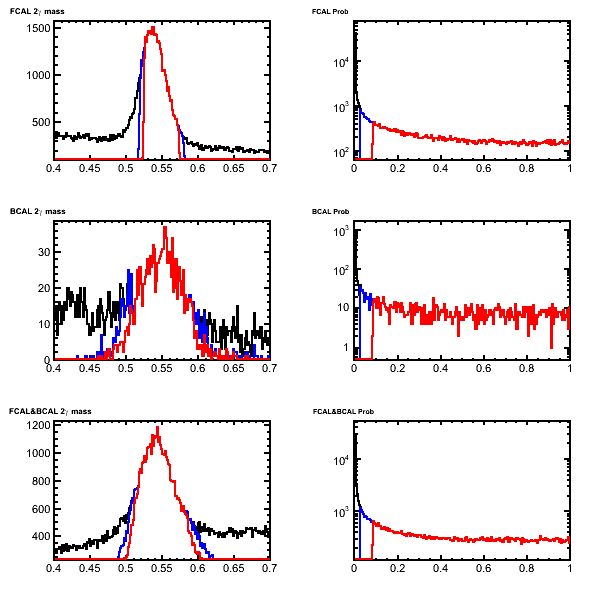
| − | * Unconstrained invariant mass (left) and fit confidence level (right) for '''eta''' candidates after the mass-constrained kinematic fit. Candidates with Chi2 < 3(5) are shown in red (blue). This can be compared with Figure 5.13 in | + | * Unconstrained invariant mass (left) and fit confidence level (right) for '''eta''' candidates after the mass-constrained kinematic fit. Candidates with Chi2 < 3(5) are shown in red (blue). These are from decays of a2(1320)to eta-pi0 to 4 gamma generated in genr8.This can be compared with Figure 5.13 in [http://argus.phys.uregina.ca/gluex/DocDB/0009/000989/001/simulation.pdf Calorimeter physics simulations and reconstruction for the Calorimetry Review (GlueX Portal)] |
| − | [http://argus.phys.uregina.ca/gluex/DocDB/0009/000989/001/simulation.pdf Calorimeter physics simulations and reconstruction for the Calorimetry Review (GlueX Portal)] | + | |
[[Image:Figure513.png]] | [[Image:Figure513.png]] | ||
Revision as of 11:52, 17 February 2009
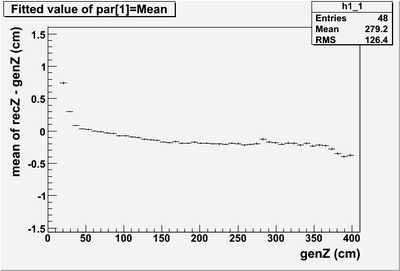
- Reconstructed Z minus generated Z over the length of the module. The deviations are less than 0.5 cm.
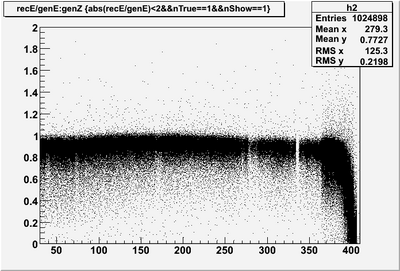
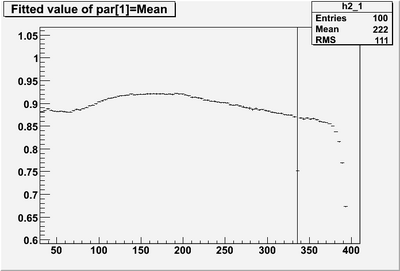
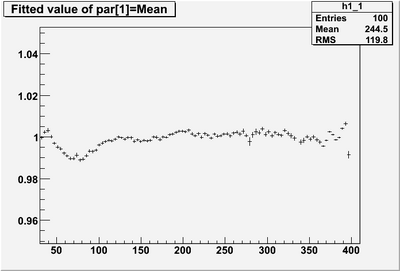
- Reconstructed photon energy BEFORE corrections
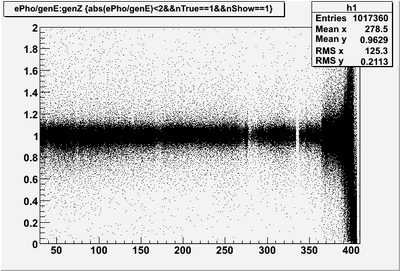
- Reconstructed photon energy AFTER corrections
- Unconstrained invariant mass (left) and fit confidence level (right) for pi0 candidates after the mass-constrained kinematic fit. Candidates with Chi2 < 3(5) are shown in red (blue). These are from decays of a2(1320)to eta-pi0 to 4 gamma generated in genr8. This can be compared with Figure 5.12 in Calorimeter physics simulations and reconstruction for the Calorimetry Review (GlueX Portal)
- Unconstrained invariant mass (left) and fit confidence level (right) for eta candidates after the mass-constrained kinematic fit. Candidates with Chi2 < 3(5) are shown in red (blue). These are from decays of a2(1320)to eta-pi0 to 4 gamma generated in genr8.This can be compared with Figure 5.13 in Calorimeter physics simulations and reconstruction for the Calorimetry Review (GlueX Portal)
