Difference between revisions of "Fiber Test Results K"
| Line 2: | Line 2: | ||
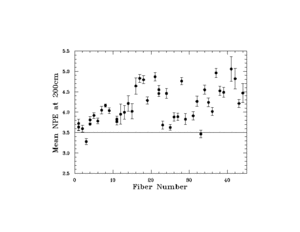
an exponential fit. Data was taken from 50cm to 320cm in steps of 10cm along the fiber. At each step the ADC spectrum is fitted and the mean number of photo electrons determined. The fiber end that was coupled to the PMT was polished, the other end was not treated. The effect of treating also the other end by painting dark and polishing will be addressed. First the final results are shown, the mean number of photo electrons at 200cm from the PMT readout | an exponential fit. Data was taken from 50cm to 320cm in steps of 10cm along the fiber. At each step the ADC spectrum is fitted and the mean number of photo electrons determined. The fiber end that was coupled to the PMT was polished, the other end was not treated. The effect of treating also the other end by painting dark and polishing will be addressed. First the final results are shown, the mean number of photo electrons at 200cm from the PMT readout | ||
is plotted for various fibers.<br> | is plotted for various fibers.<br> | ||
| − | [[Image:mnpe_fiberscan.gif| | + | [[Image:mnpe_fiberscan.gif|300px]]<br> |
For almost all fibers tests a mean number of photo electrons of more than 3.5 is found. The variation is rather large indicating some systematic effects that are not fully under control, like the quality of the fiber polishing, the coupling of the fiber to the PMT, the way the fiber is clamped etc. All these factors have not been tested but generally will lead to a smaller value of the measured mean number of photo electrons. | For almost all fibers tests a mean number of photo electrons of more than 3.5 is found. The variation is rather large indicating some systematic effects that are not fully under control, like the quality of the fiber polishing, the coupling of the fiber to the PMT, the way the fiber is clamped etc. All these factors have not been tested but generally will lead to a smaller value of the measured mean number of photo electrons. | ||
Revision as of 16:33, 23 March 2009
This section shows some results from testing SCSF-78MJ fibers. The data was taken with an XP1911 PMT and a Sr90 source scanned along the 410cm long fiber. The mean number of photo electrons has been determined and the attenuation length calculated from these data beween 150cm and 320cm using
an exponential fit. Data was taken from 50cm to 320cm in steps of 10cm along the fiber. At each step the ADC spectrum is fitted and the mean number of photo electrons determined. The fiber end that was coupled to the PMT was polished, the other end was not treated. The effect of treating also the other end by painting dark and polishing will be addressed. First the final results are shown, the mean number of photo electrons at 200cm from the PMT readout
is plotted for various fibers.

For almost all fibers tests a mean number of photo electrons of more than 3.5 is found. The variation is rather large indicating some systematic effects that are not fully under control, like the quality of the fiber polishing, the coupling of the fiber to the PMT, the way the fiber is clamped etc. All these factors have not been tested but generally will lead to a smaller value of the measured mean number of photo electrons.