First look at TOF data from Fall 2014
TOF DATA
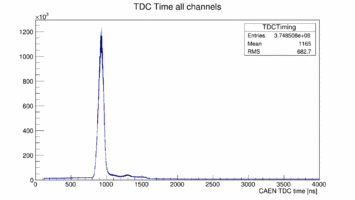
All the data are from run 2209. At first a raw look at the TDC times of all the PMTs:
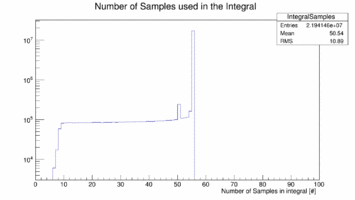
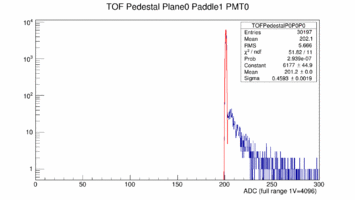
The next two images shows the number of samples used to calculate the integral of the Signal and an example pedestal:
|
|
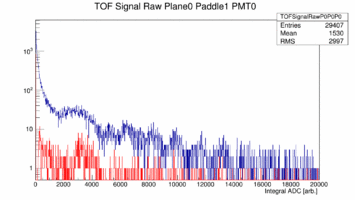
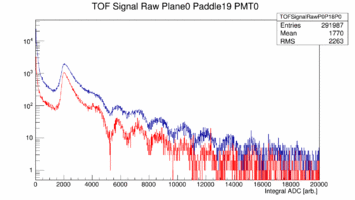
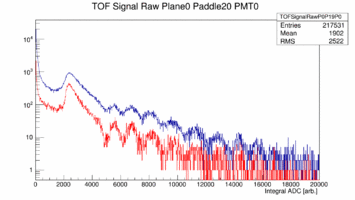
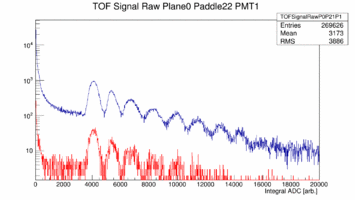
First look at ADC data from Paddle 1, 19, 20 22 of Plane 0. These paddles are double ended readout 252cm long and 6cm wide (1, 19) or 3cm wide (22) or the short paddle single ended readout (22). The plots show the raw ADC spectrum in blue with out any cuts while the red curve shows only hits that are generated in the center by cutting on the time difference between the two ends. The cut is +/- 1ns which is about +/- 16cm. Note these spectra are pedestal subtracted.
|
|
|
|
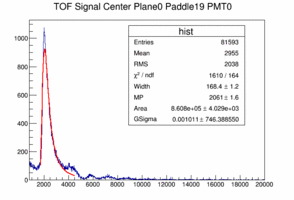
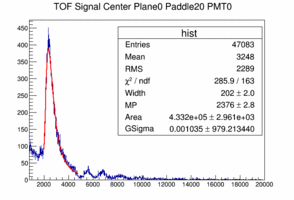
The landau peak is clearly identifiable between ADC 2000 and 4000. The following plots show a fit to the 19th and 20th paddle pmt0. The fit function is a landau convoluted with a Gaussian. Note that the width of the Gaussian is basically zero meaning that the convolution with a Gaussian is not necessary, which means that the photon statistics is not relevant, in other words: there is plenty of light.
|
|
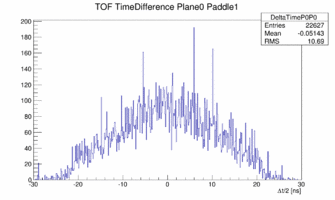
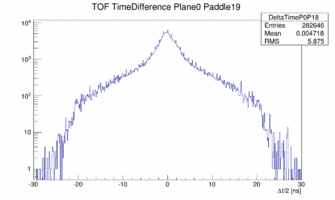
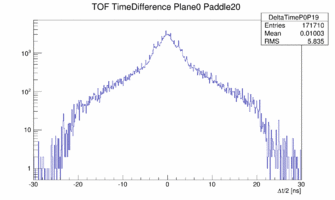
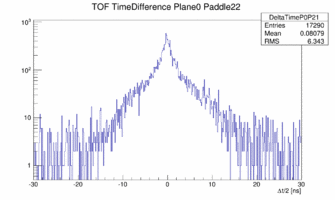
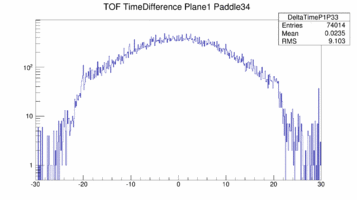
The cut on the central part of the paddle was done using the time difference between left/right PMT. And even though this is physically impossible for paddle 22 and 23 there are still left/right coincidences seen.
|
|
|
|
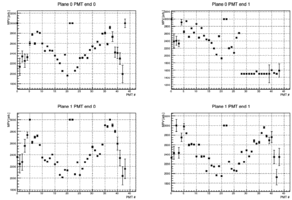
Looking at the fit result for all PMTs and plot the peak value of the landau gives the following result. The second half of the right pmts in the first plane have too low gain compared to the rest of the PMTs.
|
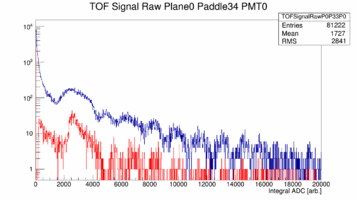
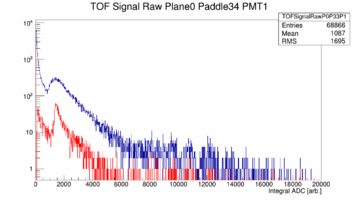
Plane 0 the 34th Paddle. the left paddle has much more gain than the right paddle:
|
|
|
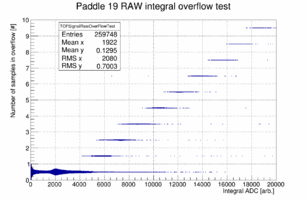
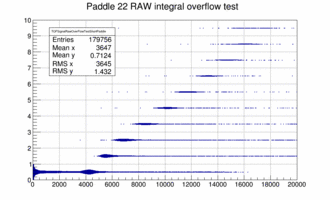
It turns out that these bumps above the landau peak are directly correlated to signals where one or more samples are overflowing and the overflow bit is set for the sample. Plotting the number of samples where the over flow bit is set vs. the adc integral for paddle 19 shows the following behavior. For paddles 18 to 44 in plane 0 this effect is very small because the ADC was replaced and the full scale was set at 2 Volt rather than 1 Volt. Similar the over flow causes the bump structure in the short paddles (like 22) as well.
|
|
TOF GEOMETRY
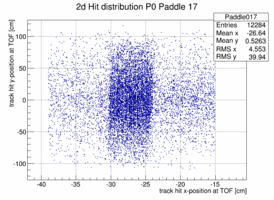
In order to look at the TOF geometry the x-y position of tracks with momenta larger than 1.5 GeV/c is plotted when a certain paddle is hit and the x or y position of the paddle is not too far of the track hit. The result is shown below for 4 different paddles. The structure of the paddle is clearly visible. Also that the paddles are not perfectly vertical or horizontal. In both planes the paddle seem to be slightly rotated/tilted with respect to the hall coordinate system in the x-y plane.
|
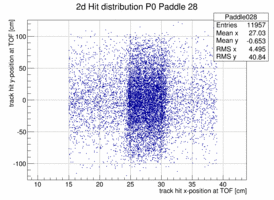
|
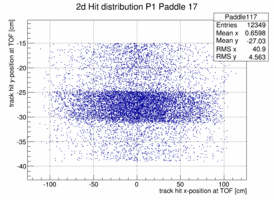
|
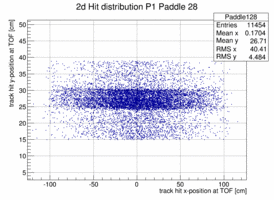
|
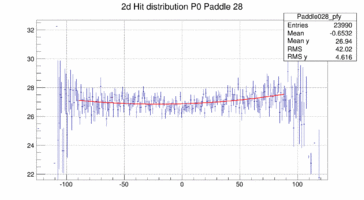
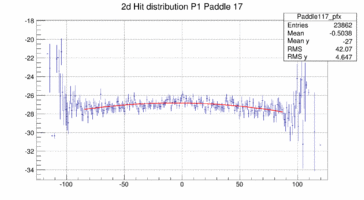
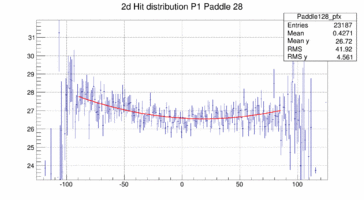
Taking these 2d distribution and do a profile in y and x respectively (and re-binning by 10 == to 1cm per bin along the paddle) the distribution can be fit with a polynomial, in this case a quadratic form. This is probably not the bets way to address the determination of the bar location in space because there is a bias to wards the center of the plane as there are more hits the closer one is to the center on the plane in particular for those hits that do not strike the paddle. The fit is clearly biased as the "bow" is drawn towards the center where the cross section and hence the number of hits is the largest.
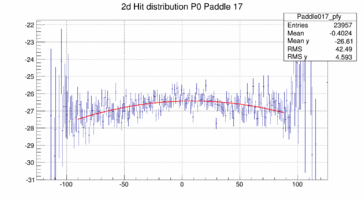
|
|
|
|
