Difference between revisions of "Flow rate"
| (8 intermediate revisions by the same user not shown) | |||
| Line 35: | Line 35: | ||
[[Image:flow_e_2050.png|thumb|400px|energy histo for 55Fe mixed 50/50 at 2050V]] | [[Image:flow_e_2050.png|thumb|400px|energy histo for 55Fe mixed 50/50 at 2050V]] | ||
|} | |} | ||
| + | The group of histograms at lower energy are those made with gas mixed with flow rate 80sccm (including the data taken at flow rate 40 sccm but straight after switching down from 80 sccm, so the gas in the buffer tank would still be the previous mix). The group at higher energy are those made 24h and later after reducing the flow to 40 sccm. There is a very slight shift up in energy after the attempted leak-fix.<br> | ||
| + | <div style="background:#d0d4fe; padding:1em 0"> | ||
| + | The event pics have been moved to [[Event pics]] | ||
| + | </div> | ||
| − | + | <span style="font-weight:bold; font-size:120%">Premixed gas</span> | |
| + | |||
| + | Premixed gas at different flow rates, cylinder -> small flowmeter -> CDC prototype. <br> | ||
| + | I used the small flowmeter and the bubble count to very approximately match the flow rates to those from the mixer (only for reference to other results where the mixer was used; the premixed gas did not go through the mixer)... | ||
| + | |||
| + | 80sccm from the mixer ~ off the top (65) of the small flowmeter ~ 1.9 ± 0.2 bubbles/s <br> | ||
| + | 40sccm from the mixer ~ small flowmeter measures 57 ± 2 ~ 1.1 ± 0.2 bubbles/s <br> | ||
| + | estimated c. 20sccm from the mixer ~ small flowmeter measures 27 ± 2 ~ 0.25 ± 0.02 bubbles/s - the prototype used to bubble at about this rate before we cooked it.<br> | ||
| + | estimated c. 10sccm from the mixer ~ small flowmeter measures 15 ± 2 ~ 0.04 ± 0.02 bubbles/s <br> | ||
| + | |||
| + | The non-linearity between flowmeter readings and bubble rate implies that the prototype is leaking at and below 20sccm. At higher flow rates, non-linearity between mixer readings and bubble rate might be caused by the small flowmeter obstructing the gas flow. <br> | ||
| + | This is consistent with the histograms below - the Ar escape peak is visible in the amplitude histogram at 1850V at 80 sccm whereas it is less evident at lower flow rates. At 1950V and 2050V the lowest flow rate histogram can be seen to have lower amplitude than the higher flow rates, which would be consistent with air leaking into the prototype at the lowest flow rate. | ||
| + | |||
| + | 1850V, amplitude (left) and energy (right) | ||
{| border="0" cellpadding="2" | {| border="0" cellpadding="2" | ||
|width="400pt"| | |width="400pt"| | ||
| − | [[Image: | + | [[Image:premix_1850.png|thumb|400px|amplitude histo for 55Fe premixed 50/50 at 1850V]] |
|width="400pt"| | |width="400pt"| | ||
| − | [[Image: | + | [[Image:premix_1850_e.png|thumb|400px|energy histo for 55Fe premixed 50/50 at 1850V]] |
|} | |} | ||
| + | 1950V, amplitude (left) and energy (right) Amplitudes < ch 300 are noise, corresponding to ch 2000 in the integrated histo. The escape peak is at approx ch 500 (amplitude) and 3000 (energy). The peak shape becomes distorted as the HV increases. | ||
| + | {| border="0" cellpadding="2" | ||
| + | |width="400pt"| | ||
| + | [[Image:premix_1950.png|thumb|400px|amplitude histo for 55Fe premixed 50/50 at 1950V]] | ||
| + | |width="400pt"| | ||
| + | [[Image:premix_1950_e.png|thumb|400px|energy histo for 55Fe premixed 50/50 at 1950V]] | ||
| + | |} | ||
| + | 2050V, amplitude (left) and energy (right) | ||
| + | {| border="0" cellpadding="2" | ||
| + | |width="400pt"| | ||
| + | [[Image:premix_2050.png|thumb|400px|amplitude histo for 55Fe premixed 50/50 at 2050V]] | ||
| + | |width="400pt"| | ||
| + | [[Image:premix_2050_e.png|thumb|400px|energy histo for 55Fe premixed 50/50 at 2050V]] | ||
| + | |} | ||
| − | + | <span style="font-weight:bold; font-size:120%">Mixed gas</span><br> | |
| + | Comparison of mixed and premixed after removing the small flowmeter between mixer and CDC (there is also a larger flowmeter mounted on the front of the mixer but the flow rate did not approach the top of this larger flowmeter).<br> | ||
| + | There is now much better agreement between the mixed and pre-mixed gas, and between the mixed gas at different flow rates than previously.<br> | ||
| + | 1850V, amplitude (left) and energy (right) | ||
{| border="0" cellpadding="2" | {| border="0" cellpadding="2" | ||
|width="400pt"| | |width="400pt"| | ||
| − | [[Image: | + | [[Image:premix_and_mix_1850.png|thumb|400px|amplitude histo for 55Fe premixed and mixed 50/50 at 1850V]] |
|width="400pt"| | |width="400pt"| | ||
| − | [[Image: | + | [[Image:premix_and_mix_1850_e.png|thumb|400px|energy histo for 55Fe premixed and mixed 50/50 at 1850V]] |
|} | |} | ||
| − | + | 1950V, amplitude (left) and energy (right) | |
{| border="0" cellpadding="2" | {| border="0" cellpadding="2" | ||
|width="400pt"| | |width="400pt"| | ||
| − | [[Image: | + | [[Image:premix_and_mix_1950.png|thumb|400px|amplitude histo for 55Fe premixed and mixed 50/50 at 1950V]] |
|width="400pt"| | |width="400pt"| | ||
| − | [[Image: | + | [[Image:premix_and_mix_1950_e.png|thumb|400px|energy histo for 55Fe premixed and mixed 50/50 at 1950V]] |
|} | |} | ||
| − | + | 2050V, amplitude (left) and energy (right) | |
{| border="0" cellpadding="2" | {| border="0" cellpadding="2" | ||
|width="400pt"| | |width="400pt"| | ||
| − | [[Image: | + | [[Image:premix_and_mix_2050.png|thumb|400px|amplitude histo for 55Fe premixed and mixed 50/50 at 2050V]] |
|width="400pt"| | |width="400pt"| | ||
| − | [[Image: | + | [[Image:premix_and_mix_2050_e.png|thumb|400px|energy histo for 55Fe premixed and mixed 50/50 at 2050V]] |
|} | |} | ||
| − | |||
| − | |||
| − | |||
| − | |||
| − | |||
| − | |||
| − | + | <span style="font-weight:bold; font-size:120%">Repeatability</span><br> | |
| − | + | As a measure to reduce neurosis I ran a few repeated counts, removing and replacing the source, resetting the HV, but not altering the flow rate. | |
1850V, amplitude (left) and energy (right) | 1850V, amplitude (left) and energy (right) | ||
{| border="0" cellpadding="2" | {| border="0" cellpadding="2" | ||
|width="400pt"| | |width="400pt"| | ||
| − | [[Image: | + | [[Image:rpt_1850.png|thumb|400px|amplitude histo for 55Fe mixed 50/50 at 1850V]] |
|width="400pt"| | |width="400pt"| | ||
| − | [[Image: | + | [[Image:rpt_1850_e.png|thumb|400px|energy histo for 55Fe mixed 50/50 at 1850V]] |
|} | |} | ||
| − | 1950V, amplitude (left) and energy (right) | + | |
| + | 1950V, amplitude (left) and energy (right) | ||
{| border="0" cellpadding="2" | {| border="0" cellpadding="2" | ||
|width="400pt"| | |width="400pt"| | ||
| − | [[Image: | + | [[Image:rpt_1950.png|thumb|400px|amplitude histo for 55Fe mixed 50/50 at 1950V]] |
|width="400pt"| | |width="400pt"| | ||
| − | [[Image: | + | [[Image:rpt_1950_e.png|thumb|400px|energy histo for 55Fe mixed 50/50 at 1950V]] |
|} | |} | ||
| + | |||
2050V, amplitude (left) and energy (right) | 2050V, amplitude (left) and energy (right) | ||
{| border="0" cellpadding="2" | {| border="0" cellpadding="2" | ||
|width="400pt"| | |width="400pt"| | ||
| − | [[Image: | + | [[Image:rpt_2050.png|thumb|400px|amplitude histo for 55Fe mixed 50/50 at 2050V]] |
|width="400pt"| | |width="400pt"| | ||
| − | [[Image: | + | [[Image:rpt_2050_e.png|thumb|400px|energy histo for 55Fe mixed 50/50 at 2050V]] |
|} | |} | ||
Latest revision as of 10:14, 8 November 2010
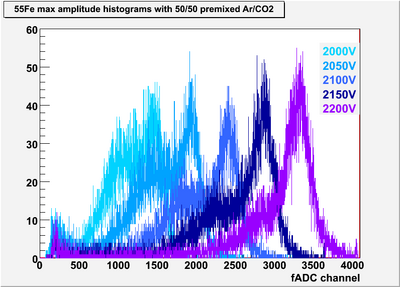
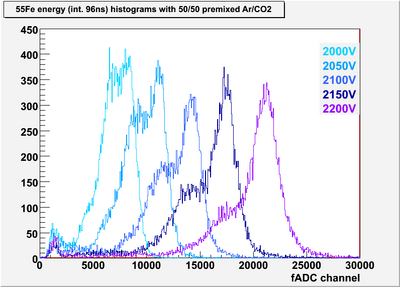
Fe55 with premixed 50/50 Ar/CO2, New preamp and new HVB, ADC half-range, for a range of HV and (later) gas flow rate
From New HVB:
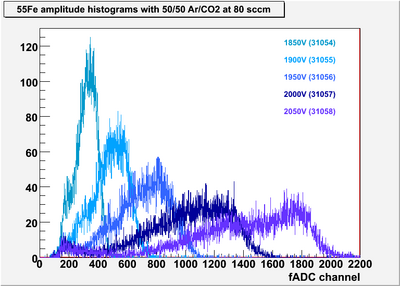
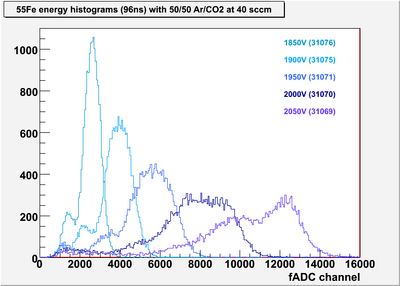
Mixed 50/50 at 80 sccm total, less HV
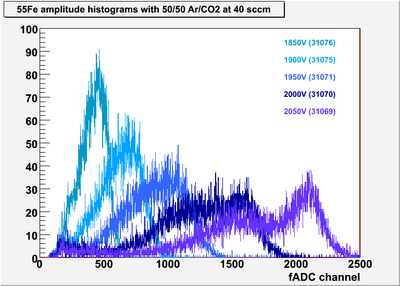
Mixed 50/50 at 40 sccm total - note the change in x-axis scale. The 2050V run was wrong initially, corrected 1340 Oct 27.
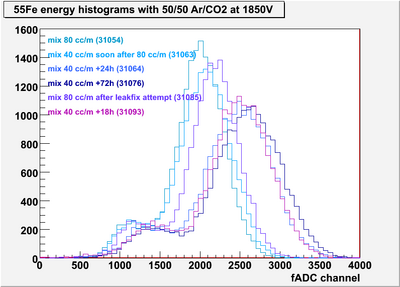
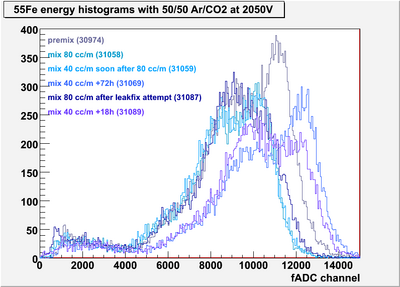
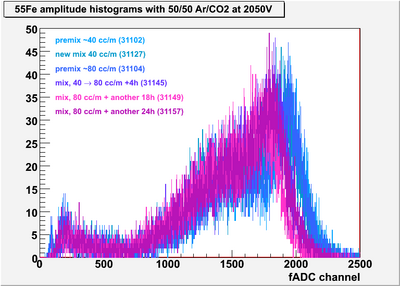
Various gas flow rates at 1850V (left) and 2050V (right)
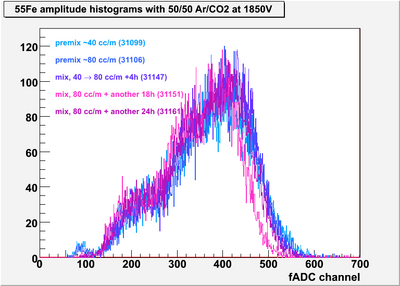
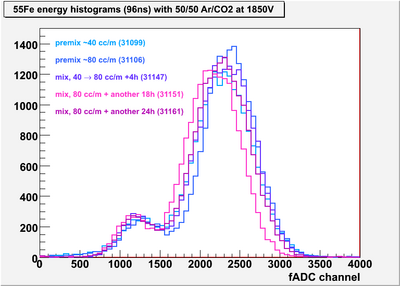
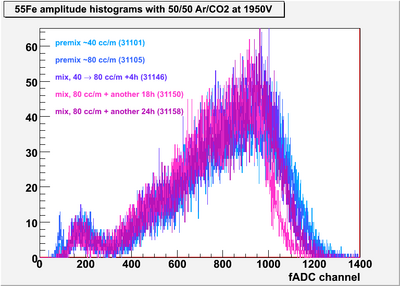
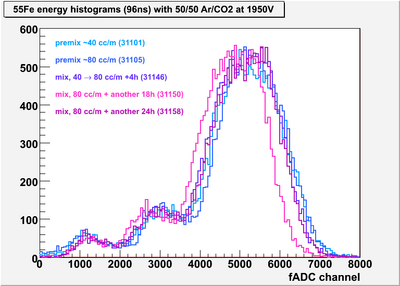
The group of histograms at lower energy are those made with gas mixed with flow rate 80sccm (including the data taken at flow rate 40 sccm but straight after switching down from 80 sccm, so the gas in the buffer tank would still be the previous mix). The group at higher energy are those made 24h and later after reducing the flow to 40 sccm. There is a very slight shift up in energy after the attempted leak-fix.
The event pics have been moved to Event pics
Premixed gas
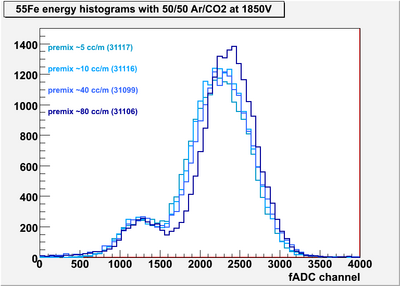
Premixed gas at different flow rates, cylinder -> small flowmeter -> CDC prototype.
I used the small flowmeter and the bubble count to very approximately match the flow rates to those from the mixer (only for reference to other results where the mixer was used; the premixed gas did not go through the mixer)...
80sccm from the mixer ~ off the top (65) of the small flowmeter ~ 1.9 ± 0.2 bubbles/s
40sccm from the mixer ~ small flowmeter measures 57 ± 2 ~ 1.1 ± 0.2 bubbles/s
estimated c. 20sccm from the mixer ~ small flowmeter measures 27 ± 2 ~ 0.25 ± 0.02 bubbles/s - the prototype used to bubble at about this rate before we cooked it.
estimated c. 10sccm from the mixer ~ small flowmeter measures 15 ± 2 ~ 0.04 ± 0.02 bubbles/s
The non-linearity between flowmeter readings and bubble rate implies that the prototype is leaking at and below 20sccm. At higher flow rates, non-linearity between mixer readings and bubble rate might be caused by the small flowmeter obstructing the gas flow.
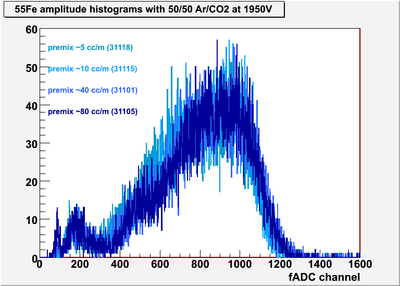
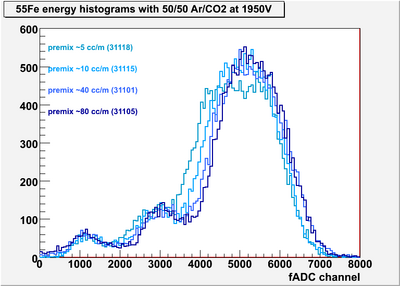
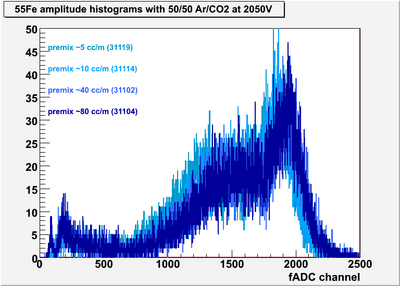
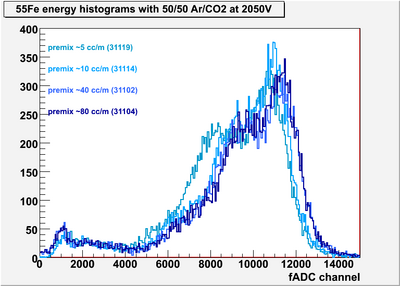
This is consistent with the histograms below - the Ar escape peak is visible in the amplitude histogram at 1850V at 80 sccm whereas it is less evident at lower flow rates. At 1950V and 2050V the lowest flow rate histogram can be seen to have lower amplitude than the higher flow rates, which would be consistent with air leaking into the prototype at the lowest flow rate.
1850V, amplitude (left) and energy (right)
1950V, amplitude (left) and energy (right) Amplitudes < ch 300 are noise, corresponding to ch 2000 in the integrated histo. The escape peak is at approx ch 500 (amplitude) and 3000 (energy). The peak shape becomes distorted as the HV increases.
2050V, amplitude (left) and energy (right)
Mixed gas
Comparison of mixed and premixed after removing the small flowmeter between mixer and CDC (there is also a larger flowmeter mounted on the front of the mixer but the flow rate did not approach the top of this larger flowmeter).
There is now much better agreement between the mixed and pre-mixed gas, and between the mixed gas at different flow rates than previously.
1850V, amplitude (left) and energy (right)
1950V, amplitude (left) and energy (right)
2050V, amplitude (left) and energy (right)
Repeatability
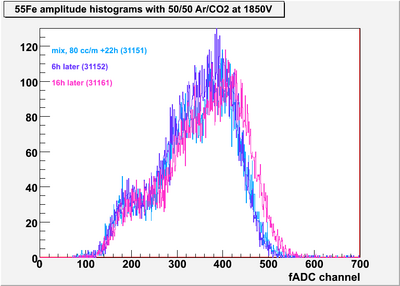
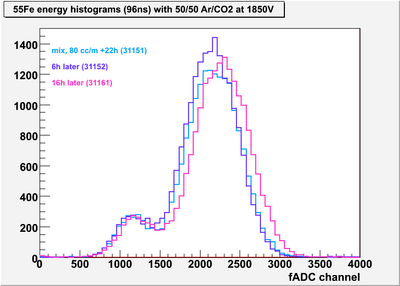
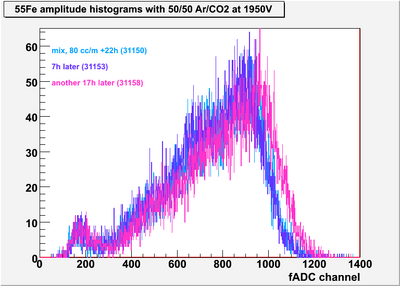
As a measure to reduce neurosis I ran a few repeated counts, removing and replacing the source, resetting the HV, but not altering the flow rate.
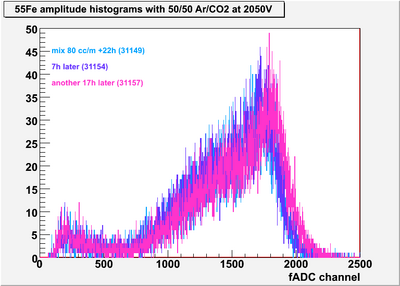
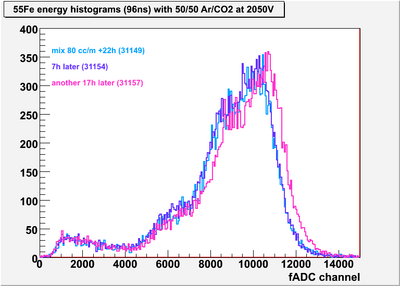
1850V, amplitude (left) and energy (right)
1950V, amplitude (left) and energy (right)
2050V, amplitude (left) and energy (right)
