Difference between revisions of "Gamma conversions in forward region"
| (14 intermediate revisions by the same user not shown) | |||
| Line 4: | Line 4: | ||
* uniform [0,360] degrees in azimuth. | * uniform [0,360] degrees in azimuth. | ||
The following figures show the position in (''r'',''z'') where the gamma conversions occurred. The shadows of the detector elements in the forward region are clearly seen, notably the CDC envelope, the FDC frames and cables, and the TOF, as well as the BCal (blue dots) and the FCal. | The following figures show the position in (''r'',''z'') where the gamma conversions occurred. The shadows of the detector elements in the forward region are clearly seen, notably the CDC envelope, the FDC frames and cables, and the TOF, as well as the BCal (blue dots) and the FCal. | ||
| − | [[Image: | + | |
| + | [[Image:xconv.gif|thumb|Gamma conversion position | ||
| + | ([http://zeus.phys.uconn.edu/halld/jlabweekly/2-27-2007/xconv.eps xconv.eps])]] | ||
| + | |||
Projections onto ''z'' and ''r'' of this distribution are shown in the following figures. The peaks in these log plots are labeled by the detector element that produces them. | Projections onto ''z'' and ''r'' of this distribution are shown in the following figures. The peaks in these log plots are labeled by the detector element that produces them. | ||
| − | [[Image: | + | [[Image:zconv.gif|thumb|Gamma conversion position projected onto ''z'' ([http://zeus.phys.uconn.edu/halld/jlabweekly/2-27-2007/zconv.eps zconv.eps])]] |
| − | [[Image: | + | [[Image:rconv.gif|thumb|Gamma conversion position projected onto ''r'' ([http://zeus.phys.uconn.edu/halld/jlabweekly/2-27-2007/rconv.eps rconv.eps])]] |
Conversions that occur inside the solenoid produce preshowers that may be difficult to reconstruct in the FCal. The next plot shows the size (in units of LGD blocks) of the energy deposition in the FCal, as measured by the second central moment | Conversions that occur inside the solenoid produce preshowers that may be difficult to reconstruct in the FCal. The next plot shows the size (in units of LGD blocks) of the energy deposition in the FCal, as measured by the second central moment | ||
| Line 13: | Line 16: | ||
<math>\frac{1}{E_{tot}}\sum_i^N E_i x_i^2-\left(\frac{1}{E_{tot}}\sum_i^N E_i x_i\right)^2</math> | <math>\frac{1}{E_{tot}}\sum_i^N E_i x_i^2-\left(\frac{1}{E_{tot}}\sum_i^N E_i x_i\right)^2</math> | ||
| − | summed over both ''x'' and ''y''. The typical RMS size of a shower produced inside the LGD is | + | summed over both ''x'' and ''y''. The typical RMS size of a shower produced inside the LGD is 2 cm, or one block radius. |
| − | [[Image:Mom2.gif|thumb|Second moment of deposition in LGD for all events]] | + | [[Image:Mom2.gif|thumb|Second moment of deposition in LGD for all events ([http://zeus.phys.uconn.edu/halld/jlabweekly/2-27-2007/mom2.eps mom2.eps])]] |
| + | In what follows, the events in the main peak are called ''good showers'' while those in the shaded peak are called ''fragmented showers''. | ||
The distribution in generated polar angle of gammas producing fragmented showers is shown in the next plot. | The distribution in generated polar angle of gammas producing fragmented showers is shown in the next plot. | ||
| − | [[Image:fragmented.gif|thumb|Generated polar angle distribution]] | + | [[Image:fragmented.gif|thumb|Generated polar angle distribution ([http://zeus.phys.uconn.edu/halld/jlabweekly/2-27-2007/fragmented.eps fragmented.eps])]] |
The conversion position for gammas producing good showers [fragmented showers] are shown by the black [red] points in the following plot. | The conversion position for gammas producing good showers [fragmented showers] are shown by the black [red] points in the following plot. | ||
| − | [[Image:Xconvf.gif|thumb|Gamma conversion position color-coded by shower size]] | + | [[Image:Xconvf.gif|thumb|Gamma conversion position color-coded by shower size ([http://zeus.phys.uconn.edu/halld/jlabweekly/2-27-2007/xconvf.eps xconvf.eps])]] |
Images of individual events where conversions took place inside the solenoid and downstream near the face of the FCal. One can see that the correspondence between early conversion and fragmented showers is not perfect, but | Images of individual events where conversions took place inside the solenoid and downstream near the face of the FCal. One can see that the correspondence between early conversion and fragmented showers is not perfect, but | ||
| Line 25: | Line 29: | ||
{| | {| | ||
| − | + | !width="200" align="left"|''z''<sub>conv</sub> > 600cm | |
| − | | | + | !width="200" align="left"|''z''<sub>conv</sub> < 400cm |
| − | [[http://zeus.phys.uconn.edu/halld/jlabweekly/ev1401.eps | + | |- |
| + | |[http://zeus.phys.uconn.edu/halld/jlabweekly/2-27-2007/ev169.eps ev169.eps] | ||
| + | |[http://zeus.phys.uconn.edu/halld/jlabweekly/2-27-2007/ev1401.eps ev1401.eps] | ||
| + | |- | ||
| + | |[http://zeus.phys.uconn.edu/halld/jlabweekly/2-27-2007/ev169.eps ev169.eps] | ||
| + | |[http://zeus.phys.uconn.edu/halld/jlabweekly/2-27-2007/ev1401.eps ev1401.eps] | ||
| + | |- | ||
| + | |[http://zeus.phys.uconn.edu/halld/jlabweekly/2-27-2007/ev173.eps ev173.eps] | ||
| + | |[http://zeus.phys.uconn.edu/halld/jlabweekly/2-27-2007/ev1416.eps ev1416.eps] | ||
| + | |- | ||
| + | |[http://zeus.phys.uconn.edu/halld/jlabweekly/2-27-2007/ev176.eps ev176.eps] | ||
| + | |[http://zeus.phys.uconn.edu/halld/jlabweekly/2-27-2007/ev1422.eps ev1422.eps] | ||
| + | |- | ||
| + | |[http://zeus.phys.uconn.edu/halld/jlabweekly/2-27-2007/ev179.eps ev179.eps] | ||
| + | |[http://zeus.phys.uconn.edu/halld/jlabweekly/2-27-2007/ev1446.eps ev1446.eps] | ||
| + | |- | ||
| + | |[http://zeus.phys.uconn.edu/halld/jlabweekly/2-27-2007/ev189.eps ev189.eps] | ||
| + | |[http://zeus.phys.uconn.edu/halld/jlabweekly/2-27-2007/ev1460.eps ev1460.eps] | ||
| + | |- | ||
| + | |[http://zeus.phys.uconn.edu/halld/jlabweekly/2-27-2007/ev193.eps ev193.eps] | ||
| + | |[http://zeus.phys.uconn.edu/halld/jlabweekly/2-27-2007/ev1466.eps ev1466.eps] | ||
| + | |- | ||
| + | |[http://zeus.phys.uconn.edu/halld/jlabweekly/2-27-2007/ev197.eps ev197.eps] | ||
| + | |[http://zeus.phys.uconn.edu/halld/jlabweekly/2-27-2007/ev1481.eps ev1481.eps] | ||
| + | |- | ||
| + | |[http://zeus.phys.uconn.edu/halld/jlabweekly/2-27-2007/ev204.eps ev204.eps] | ||
| + | |[http://zeus.phys.uconn.edu/halld/jlabweekly/2-27-2007/ev1487.eps ev1487.eps] | ||
| + | |- | ||
| + | |[http://zeus.phys.uconn.edu/halld/jlabweekly/2-27-2007/ev209.eps ev209.eps] | ||
| + | |[http://zeus.phys.uconn.edu/halld/jlabweekly/2-27-2007/ev1499.eps ev1499.eps] | ||
| + | |- | ||
| + | |[http://zeus.phys.uconn.edu/halld/jlabweekly/2-27-2007/ev210.eps ev210.eps] | ||
| + | |[http://zeus.phys.uconn.edu/halld/jlabweekly/2-27-2007/ev1508.eps ev1508.eps] | ||
| + | |- | ||
|} | |} | ||
Latest revision as of 08:57, 28 February 2007
A set of gamma rays were generated at the center of the target and tracked through the GlueX detector using HDGeant. The gamma momenta were generated
- uniform [0,6] GeV in energy,
- uniform [0,16] degrees in polar angle,
- uniform [0,360] degrees in azimuth.
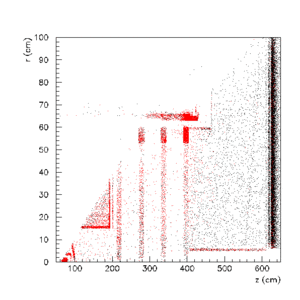
The following figures show the position in (r,z) where the gamma conversions occurred. The shadows of the detector elements in the forward region are clearly seen, notably the CDC envelope, the FDC frames and cables, and the TOF, as well as the BCal (blue dots) and the FCal.
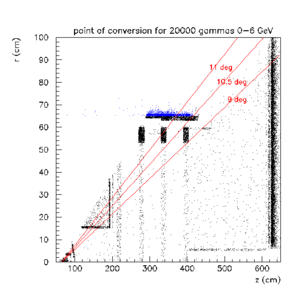
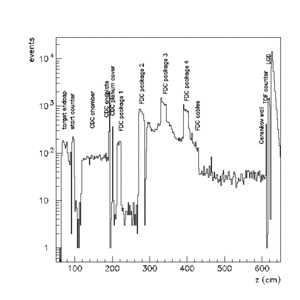
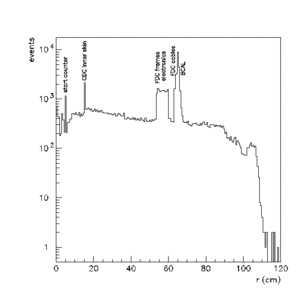
Projections onto z and r of this distribution are shown in the following figures. The peaks in these log plots are labeled by the detector element that produces them.
Conversions that occur inside the solenoid produce preshowers that may be difficult to reconstruct in the FCal. The next plot shows the size (in units of LGD blocks) of the energy deposition in the FCal, as measured by the second central moment

summed over both x and y. The typical RMS size of a shower produced inside the LGD is 2 cm, or one block radius.
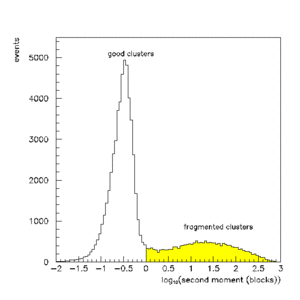
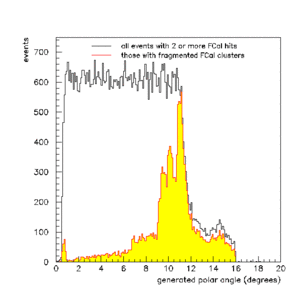
In what follows, the events in the main peak are called good showers while those in the shaded peak are called fragmented showers.
The distribution in generated polar angle of gammas producing fragmented showers is shown in the next plot.
The conversion position for gammas producing good showers [fragmented showers] are shown by the black [red] points in the following plot.
Images of individual events where conversions took place inside the solenoid and downstream near the face of the FCal. One can see that the correspondence between early conversion and fragmented showers is not perfect, but there is a clear correlation between the two.