Difference between revisions of "Kinematic Fitting of Two Photon Decays"
From GlueXWiki
m (→Procedure) |
|||
| (2 intermediate revisions by one other user not shown) | |||
| Line 1: | Line 1: | ||
| − | Procedure | + | ===Procedure=== |
* generate 1 GeV η's which decay generically in the GlueX detector | * generate 1 GeV η's which decay generically in the GlueX detector | ||
| Line 8: | Line 8: | ||
** tests the accuracy of the photon covariance matrix | ** tests the accuracy of the photon covariance matrix | ||
| − | + | ===Results=== | |
| − | Results | + | |
The plots below show confidence level and two photon invariant mass for four types of fits: | The plots below show confidence level and two photon invariant mass for four types of fits: | ||
| Line 21: | Line 20: | ||
[[Image:Two_gam_fit.jpg]] | [[Image:Two_gam_fit.jpg]] | ||
| + | |||
| + | The plot below shows, as an example, the pull distribution for the x component of the momentum for one of the photons. If errors are properly modeled in the covariance matrix, the pull distributions for all of the kinematic variables should be a unit Gaussian centered on zero. | ||
| + | |||
| + | [[Image:Sample_pull.jpg]] | ||
Latest revision as of 13:08, 4 September 2007
Procedure
- generate 1 GeV η's which decay generically in the GlueX detector
- reconstruct η→γγ and π0→γγ
- π0 produced in η decay have low momentum
- very few additional "clean-up" cuts applied
- kinematically fit η's and π0's and examine confidence level distributions and pull distributions.
- tests the accuracy of the photon covariance matrix
Results
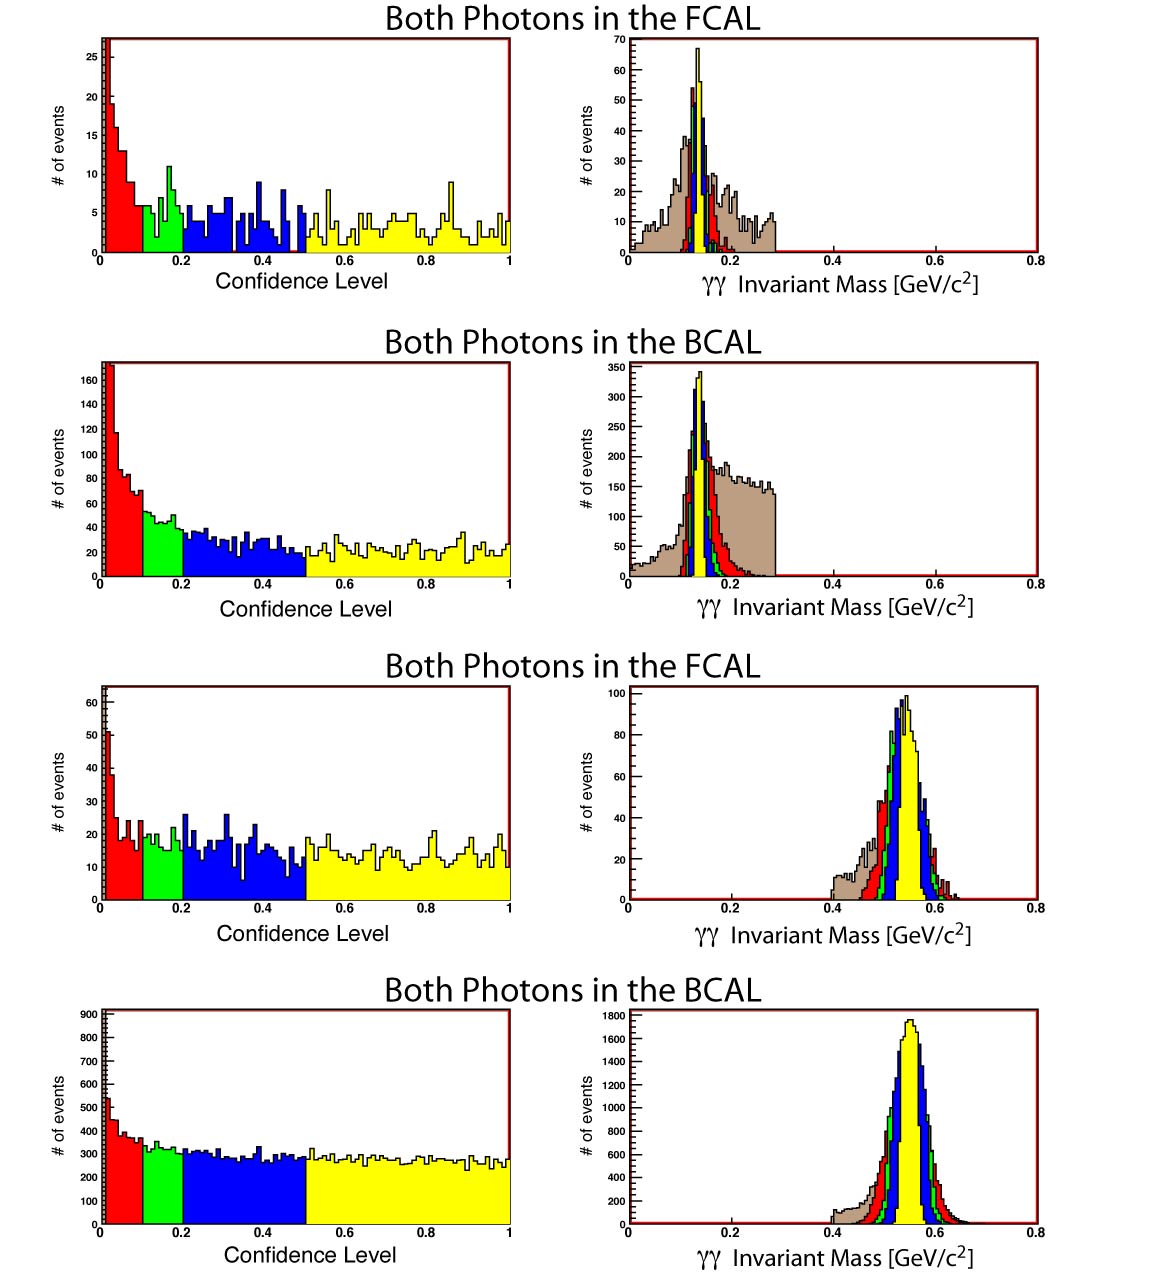
The plots below show confidence level and two photon invariant mass for four types of fits:
- π0 fit with two photons in the FCAL
- π0 fit with two photons in the BCAL
- η fit with two photons in the FCAL
- η fit with two photons in the BCAL
Combinatoric backgrounds produce a peak at low confidence level and tails away from the nominal two-photon invariant mass. The relatively flat confidence level distribution is an indication that photon covariance matrices are properly constructed.
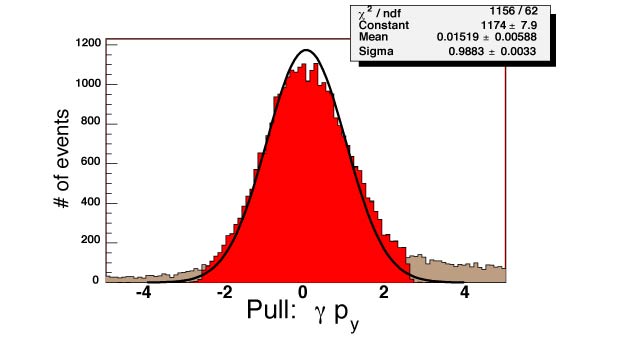
The plot below shows, as an example, the pull distribution for the x component of the momentum for one of the photons. If errors are properly modeled in the covariance matrix, the pull distributions for all of the kinematic variables should be a unit Gaussian centered on zero.

