Difference between revisions of "Meeting-3-22-2018"
From GlueXWiki
(→Agenda) |
|||
| Line 35: | Line 35: | ||
= Minutes = | = Minutes = | ||
| − | Participants: Naomi (CMU) Eugene, Beni | + | Participants: Naomi (CMU) Sean(FSU), Eugene, Beni, Simon, Alex A., Thomas, Sergey, and Lubomir (JLab). |
| − | = | + | = CDC settings for the rest of the run = |
| − | + | Beni summarized the information related to the CDC thresholds from the hardware threshold scans and his software threshold scan. | |
| − | |||
| − | |||
| − | |||
| − | |||
| − | |||
| − | |||
| − | |||
| − | |||
| − | |||
--> | --> | ||
Revision as of 18:43, 23 March 2018
March 22, 2018 Drift Chamber meeting
Connection
- Instructions for Bluejeans meeting connection
- Meeting ID: 290664653
Headline text
- To join via a Web Browser, go to the page [1] https://bluejeans.com/290664653.
Agenda
- CDC settings for the rest of the run
- Results from the CDC threshold scan run 41611 to 41614 (CDC hardware threshold 90, 110, 120, 140)
- normalized rho yields at TH=120 increase by 4.3%, at TH=140 increase by 5.8%. Since these are different runs the data was normalized to the PS-flux
- the rho yields seem to scale linearly with CDC hardware threshold.
- CDC software threshold scan using run 41611 with hardware threshold at 90. First 3 files of the run are analyzed, same data so no normalization necessary. At 110 a rho yield increase of 3.3% is seen, at 140 a rho yield increase of 3.7% is seen, at 150 a rho yield increase of 3.4% is seen, at 160 a rho yield increase of 2.7% is seen.
- the rho yields do not scale linearly with software threshold! They saturate at about 140 (same as the highest hardware threshold)
- the software threshold of 140 leads to a rho yield increase of 3.7% while the hardware threshold of 140 to about 5.8%, this may be an indication that there is some shadowing effect.
- run 41614 with hardware threshold at 140, an increase of the software threshold from 150 to 160 does not increase the rho yield at a measurable level.
- Note that a higher software threshold may lead to lower rho yields before kinematic fitting, however after kinematic fitting more rhos are left! This is particular significant when going from a software threshold of 110 to 140, see logbook entry: https://logbooks.jlab.org/entry/3544993
- Impact of the CDC Hit timing cut in the track reconstruction
- The increase in rho yield is significant. The cut is set at -60ns to 900ns
- The higher the luminosity the higher the impact. At the highest luminosity (Run 41343) the impact was a factor of 2 increase in rho yield.
- Similar effects are observed in the omega yields (both decay modes).
- Impact of CDC Hit pruning, the removal of hits correlated in time with high amplitude hits that go into saturation on the same preamp card.
- A test on run 41343 with and without this pruning results in a increase rho yield of 4.6% when pruning is applied. see also https://logbooks.jlab.org/entry/3543986 and https://logbooks.jlab.org/entry/3543986
- Results from the CDC threshold scan run 41611 to 41614 (CDC hardware threshold 90, 110, 120, 140)
- Other
- Impact of threshold scan on CDC hit efficiency (Alex)
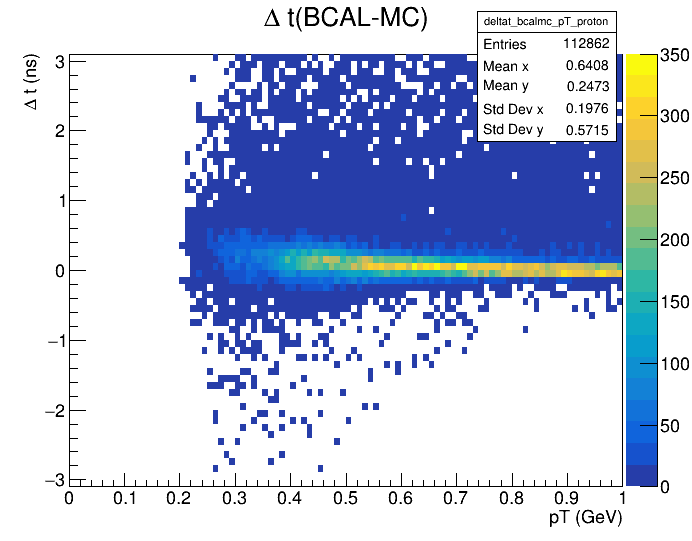
- Track matched hit timing in MC: Proton in SC proton in BCAL (Sean)