Difference between revisions of "PreAmp tests with premixed 90/10 Ar/CO2 - software threshold"
(→1425V) |
(→1450V) |
||
| Line 11: | Line 11: | ||
|} | |} | ||
| − | Max amplitude | + | Max amplitude histograms for fADCthresholds 3, 4 |
{| border="1" cellpadding="2" | {| border="1" cellpadding="2" | ||
|width="400pt"|[[Image:amp_thr3_1450V.jpg|thumb|none|400px|Max amplitude histogram, software threshold 3, 1450V, 90/10 premix]] | |width="400pt"|[[Image:amp_thr3_1450V.jpg|thumb|none|400px|Max amplitude histogram, software threshold 3, 1450V, 90/10 premix]] | ||
Revision as of 11:22, 19 July 2010
We started at 1450V for premixed 90/10 Ar/CO2 (as that was the optimum HV determined previously) and varied the software acceptance threshold, then repeated for 1475V and 1425V.
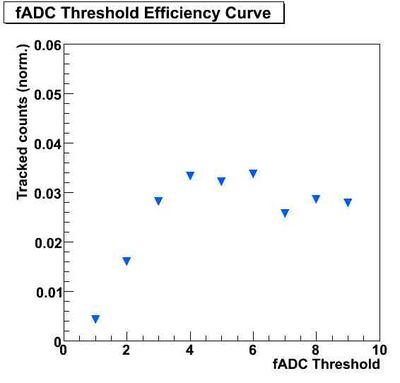
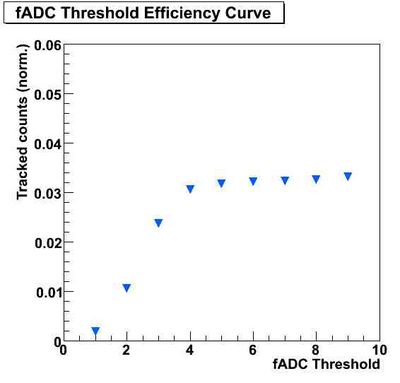
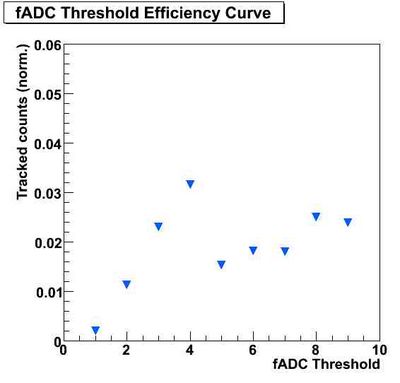
In the analysis software, events are required to have a minimum amplitude of (pedestal_mean) + (fADCthreshold)*pedestal_sigma. Tracking efficiency is calculated as (number of events containing valid tracks)/(number of cosmic triggers from the scintillators above and below the prototype).
1450V
Tracking efficiency as a function of fADCthreshold
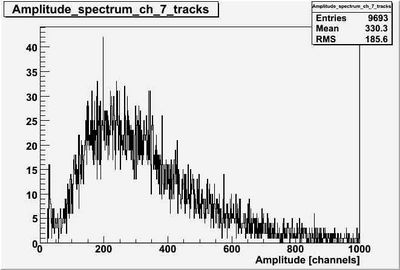
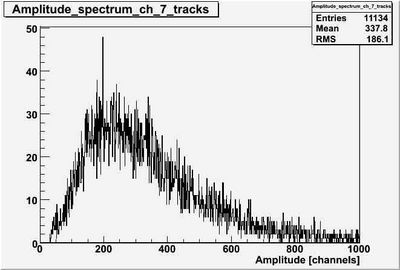
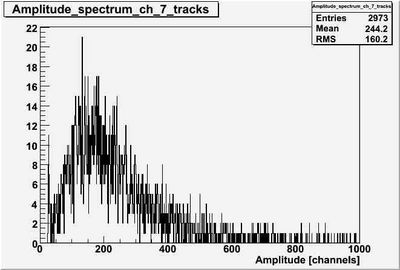
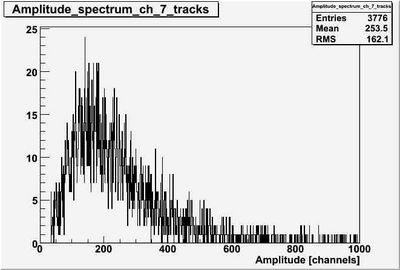
Max amplitude histograms for fADCthresholds 3, 4
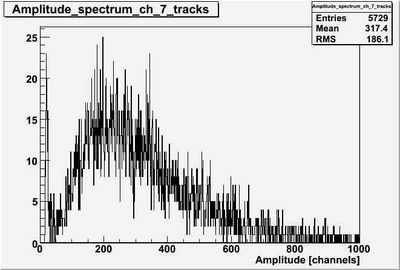
Max amplitude histogram for fADCthreshold 2
1475V
Tracking efficiency as a function of fADCthreshold
1425V
Tracking efficiency as a function of fADCthreshold
Max amplitude histograms for fADCthresholds 3, 4
