Difference between revisions of "RunPeriod-2022-08 Validation"
(→Monitoring Status) |
(→Production checklist) |
||
| (44 intermediate revisions by 6 users not shown) | |||
| Line 1: | Line 1: | ||
| + | = Production checklist = | ||
| + | * Check RF monitoring plots - done (no FDC RF 110641-110796) | ||
| + | * '''Check other monitoring histos - [https://halldweb.jlab.org/wiki/index.php/RunPeriod-2022-08_Validation#Monitoring_Status see below] expert checks paused until v16 | ||
| + | * '''Recalibrations - waiting for BCAL | ||
| + | * '''Geometry - waiting for sdmes | ||
| + | * '''Final monitoring launch to check recalibrations''' | ||
| + | |||
| + | <br/> | ||
=Run List= | =Run List= | ||
| Line 48: | Line 56: | ||
| CDC || done || done | | CDC || done || done | ||
|- | |- | ||
| − | | FCAL || Timing, Occupancy, and pi0 Peak: | + | | FCAL || Timing, Occupancy, and pi0 Peak: done || pending |
|- | |- | ||
| FDC || done || pending | | FDC || done || pending | ||
|- | |- | ||
| − | | PS/PSC || Timing, Occupancy, and PS pair energy: | + | | PS/PSC || Timing, Occupancy, and PS pair energy: done || pending |
|- | |- | ||
| − | | SC || | + | | SC || done || pending |
|- | |- | ||
| − | | TAGH/TAGM || | + | | TAGH/TAGM || done || pending |
|- | |- | ||
| − | | TOF || | + | | TOF || done || pending |
|- | |- | ||
| − | | Timing || | + | | Timing || done || done |
|- | |- | ||
| Analysis || DONE || pending | | Analysis || DONE || pending | ||
| Line 75: | Line 83: | ||
=Notes= | =Notes= | ||
| − | * | + | * runs with solenoid and DCs switched off: 110476 - 110482, 110600 - 110621, 111969 - 112001 |
| − | + | ||
| − | + | ||
| − | + | ||
| − | + | ||
==Problem runs== | ==Problem runs== | ||
| − | * | + | * 111137 - 111145 (target full and ready) FCAL fADC module issue |
| − | *111694 | + | ** started: "10/21 Owl Sift Summary" https://logbooks.jlab.org/entry/4065653 |
| + | ** 111137 hot channels in upper left quadrant of occupancy | ||
| + | ** 111138 - 111139 junk | ||
| + | ** 111140 - 111145 fADC module taken out of trigger, no entries in same channels of occupancy | ||
| + | ** fixed: "Day shift 10/22/2022" https://logbooks.jlab.org/entry/4066120 | ||
| + | |||
| + | * 111404 - 111412 (target empty and ready) FCAL fADC module issue | ||
| + | ** started: "OWL Shift Summary 11/11/22" https://logbooks.jlab.org/entry/4081215 | ||
| + | ** 111404 - 111405 hot channels at top/middle of occupancy | ||
| + | ** 111406 - 111412 fADC module taken out of trigger, no entries in same channels of occupancy | ||
| + | ** 111413 junk | ||
| + | ** fixed: "Day Shift Summary" https://logbooks.jlab.org/entry/4081637 | ||
| + | |||
| + | * 111693 - 111694 (target empty and ready) FCAL fADC module issue, hot channels | ||
| + | ** started & fixed: "Early Riser Summary 11/30/2022" https://logbooks.jlab.org/entry/4093128 | ||
| + | |||
| + | * 110447 - 110482 and 110538 - 110621 - SC has 3 bad channels | ||
| + | ** logbook entries: [https://logbooks.jlab.org/entry/4035722], [https://logbooks.jlab.org/entry/4035800], [https://logbooks.jlab.org/entry/4037699] | ||
| + | |||
| + | * 111084 - 111090 | ||
| + | ** bad TAGM fADC - masking these channels | ||
| + | |||
| + | == ver13 monitoring launch == | ||
| + | |||
| + | * Runs to ignore: 110469, 110485, 110486 - marked as bad | ||
| + | * Run 111771 - looks like SC electronics weren't correctly initialized - marked as bad | ||
| + | * This is a weird one (two) on the latest monitoring - 111404, 111405 - calibrations mostly seem okay, but the rate of good events is low. I think that the rate is thrown off by the bad FCAL fADC - could consider just tossing this run. | ||
| + | ** 111694 also seems driven by a noisy fADC | ||
| + | ** all three marked as bad | ||
| + | * Problematic TAGM channel: 64 | ||
| + | * These runs should have been marked as solenoid off, but were not - this is fixed now - 110469-110482, 110600-110621, 111969-112001 | ||
| + | * 5 runs w low cdc efficiency are ok in ver 12 and 14. | ||
| + | * runs with bad TAGM fADC - 111084 - 111090 | ||
| + | |||
| + | === Notes from Beni === | ||
| + | |||
| + | * 110447-110485 - NO DATA: why are these runs in reconstruction? - check next launch | ||
| + | * 110600-110621 - NO DATA: same? - check next launch | ||
| + | * 110535 - LOW STATISTICS | ||
| + | * 110987-110990 - MISSING SHORT PADDLES VERTICAL PLANE DOWN: HV trip? - bad fADC, rejecting these runs | ||
| + | * 111206 - LOW STATISTICS | ||
| + | * 111290 - LOW STATISTICS | ||
| + | * 111404-111405 - NO DATA: ONLY INNERMOST FCAL RING SEEN? TRIGGER? - thrown out for trigger problems | ||
| + | * 111430 - LOW STATISTCIS | ||
| + | * 111694 - NO DATA: SAME AS 111404-111405 | ||
| + | * 111771 - GOOD: ALL OK - run rejected for other reasons above | ||
| + | * 111969-112001 - NO DATA | ||
| + | |||
| + | ''Additional comments on low statistics runs'' | ||
| + | |||
| + | run 110535 according to the log book the beam was off for quite some time and they | ||
| + | did not stop the run. So the first files contain a lot of just cosmic triggers: | ||
| + | logbook excerpt: | ||
| + | 5:25 am End of run 110534. Start run 110535. | ||
| + | 6:10 am Beam is back!! (was down for 20 minutes) | ||
| + | |||
| + | run 111206 is a 3 minute run, drop it! | ||
| + | |||
| + | run111290 is 20min run mostly cosmic, forget it! | ||
| + | logbook says | ||
| + | 09:20 No beam for last 15 minutes. Stop run 111290. | ||
| + | |||
| + | run 111430: 8 minute run forget it. | ||
| + | logbook says: | ||
| + | 11:22 Start the run 111430 | ||
| + | 11:30 MCC informed that they ran with same issue again while tuning up the beam so troubleshooting the issue continuously until it is resolved | ||
| + | 11:30 Stop the run 111430, junked it, | ||
| + | |||
| + | == ver14 monitoring launch == | ||
| + | |||
| + | Note that this launch was performed before most of the above changes were made. Also, the SC geometry was fixed, but the calibrations were not updated yet. | ||
| + | |||
| + | * Missing SC channels - 110447 - 110621 | ||
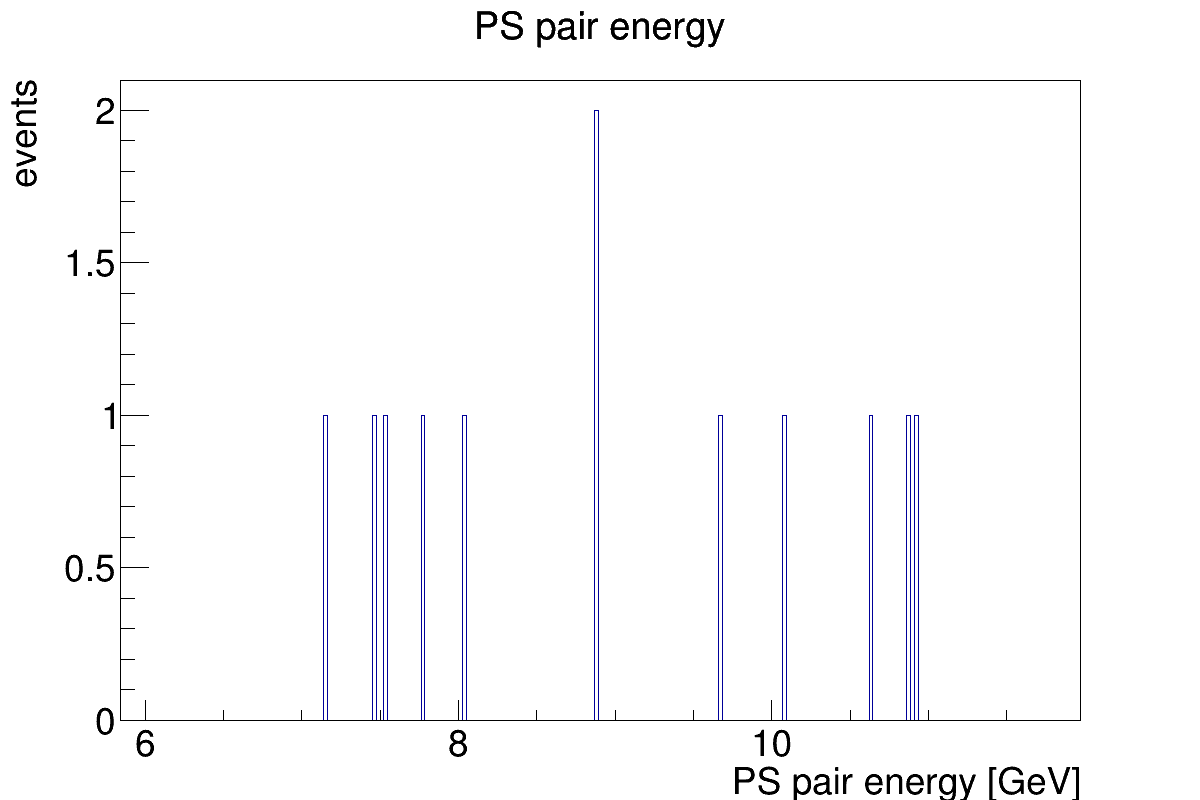
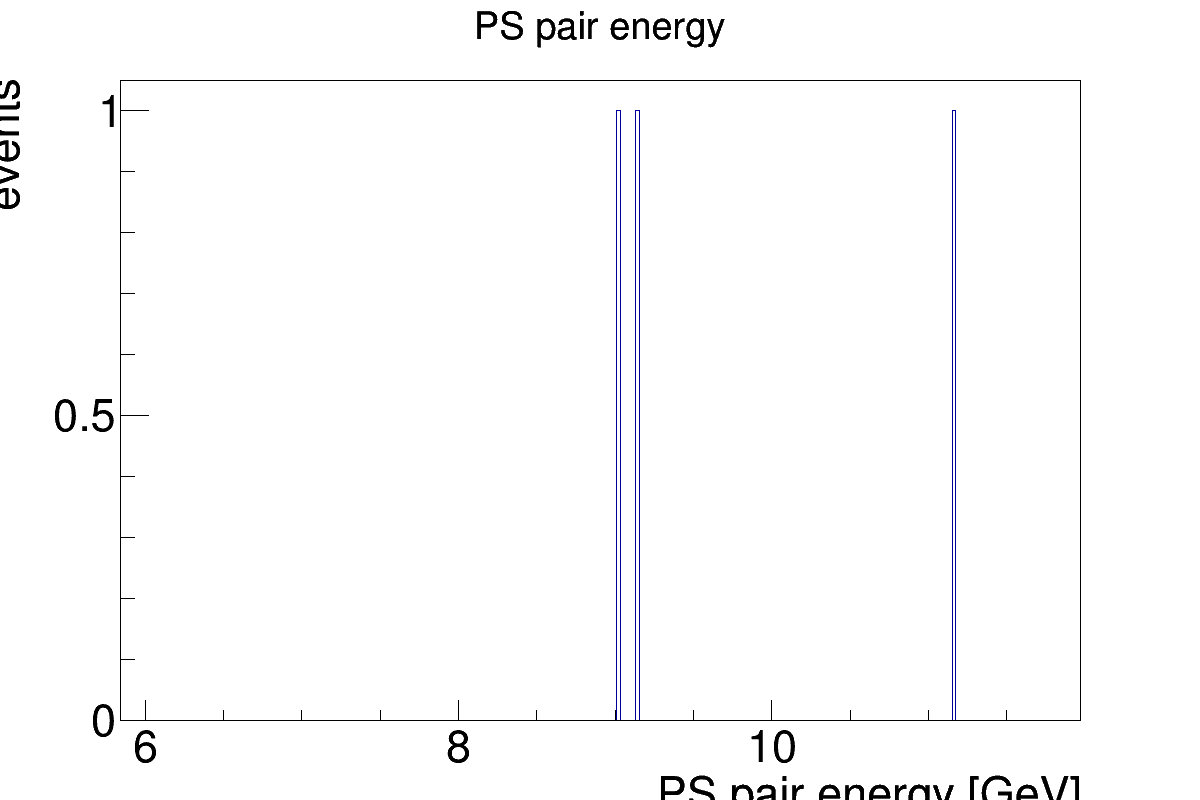
| + | * 111200-111201 : No PS E counts [https://halldweb.jlab.org/work/halld2/data_monitoring/RunPeriod-2022-08/mon_ver01/Run111201/__PSPair_PSC_PS_PS_E.png 111201] | ||
| + | * [https://halldweb.jlab.org/work/halld2/data_monitoring/RunPeriod-2022-08/mon_ver15/Run111569/__PSPair_PSC_PS_PS_E.png 111569], [https://halldweb.jlab.org/work/halld2/data_monitoring/RunPeriod-2022-08/mon_ver15/Run111598/__PSPair_PSC_PS_PS_E.png 111598] : No PS E counts | ||
Revision as of 11:04, 11 April 2024
Contents
Production checklist
- Check RF monitoring plots - done (no FDC RF 110641-110796)
- Check other monitoring histos - see below expert checks paused until v16
- Recalibrations - waiting for BCAL
- Geometry - waiting for sdmes
- Final monitoring launch to check recalibrations
Run List
Monitoring Launch Checks
Team members
- BCAL: Zisis Papandreou/Regina + Tolga Erbora
- CCAL: Drew Smith
- CDC: Alison Laduke
- FCAL: Susan Schadmand
- FDC: Dene Hoffman
- PS/PSC: Susan Schadmand
- SC: Viviana Arroyave
- TAGH/TAGM: Saheli Rakshit
- TOF: Jesse Hernandez
- Timing: Nizar Septian
- Analysis: Zach Baldwin
Detector/Calibration Experts
- BCAL: Mark Dalton, Zisis Papandreou, Igal Jaegle
- CCAL: Drew Smith
- CDC: Naomi Jarvis
- FCAL: Mark Dalton, Malte Albrecht, Igal Jaegle
- FDC: Lubomir Pentchev
- PS/PSC: Alex Somov, Olga Cortes
- SC: Beni Zihlmann
- TAGH: Alex Somov, Bo Yu
- TAGM: Richard Jones, Ellie Prather
- TOF: Paul Eugenio, Beni Zihlmann
- Timing: Sean Dobbs
- Analysis: Igal Jaegle
Monitoring Status
| Detector | Monitoring | Expert checks |
|---|---|---|
| BCAL | in progress | pending |
| CCAL | done | done |
| CDC | done | done |
| FCAL | Timing, Occupancy, and pi0 Peak: done | pending |
| FDC | done | pending |
| PS/PSC | Timing, Occupancy, and PS pair energy: done | pending |
| SC | done | pending |
| TAGH/TAGM | done | pending |
| TOF | done | pending |
| Timing | done | done |
| Analysis | DONE | pending |
Data monitoring
Notes
- runs with solenoid and DCs switched off: 110476 - 110482, 110600 - 110621, 111969 - 112001
Problem runs
- 111137 - 111145 (target full and ready) FCAL fADC module issue
- started: "10/21 Owl Sift Summary" https://logbooks.jlab.org/entry/4065653
- 111137 hot channels in upper left quadrant of occupancy
- 111138 - 111139 junk
- 111140 - 111145 fADC module taken out of trigger, no entries in same channels of occupancy
- fixed: "Day shift 10/22/2022" https://logbooks.jlab.org/entry/4066120
- 111404 - 111412 (target empty and ready) FCAL fADC module issue
- started: "OWL Shift Summary 11/11/22" https://logbooks.jlab.org/entry/4081215
- 111404 - 111405 hot channels at top/middle of occupancy
- 111406 - 111412 fADC module taken out of trigger, no entries in same channels of occupancy
- 111413 junk
- fixed: "Day Shift Summary" https://logbooks.jlab.org/entry/4081637
- 111693 - 111694 (target empty and ready) FCAL fADC module issue, hot channels
- started & fixed: "Early Riser Summary 11/30/2022" https://logbooks.jlab.org/entry/4093128
- 111084 - 111090
- bad TAGM fADC - masking these channels
ver13 monitoring launch
- Runs to ignore: 110469, 110485, 110486 - marked as bad
- Run 111771 - looks like SC electronics weren't correctly initialized - marked as bad
- This is a weird one (two) on the latest monitoring - 111404, 111405 - calibrations mostly seem okay, but the rate of good events is low. I think that the rate is thrown off by the bad FCAL fADC - could consider just tossing this run.
- 111694 also seems driven by a noisy fADC
- all three marked as bad
- Problematic TAGM channel: 64
- These runs should have been marked as solenoid off, but were not - this is fixed now - 110469-110482, 110600-110621, 111969-112001
- 5 runs w low cdc efficiency are ok in ver 12 and 14.
- runs with bad TAGM fADC - 111084 - 111090
Notes from Beni
- 110447-110485 - NO DATA: why are these runs in reconstruction? - check next launch
- 110600-110621 - NO DATA: same? - check next launch
- 110535 - LOW STATISTICS
- 110987-110990 - MISSING SHORT PADDLES VERTICAL PLANE DOWN: HV trip? - bad fADC, rejecting these runs
- 111206 - LOW STATISTICS
- 111290 - LOW STATISTICS
- 111404-111405 - NO DATA: ONLY INNERMOST FCAL RING SEEN? TRIGGER? - thrown out for trigger problems
- 111430 - LOW STATISTCIS
- 111694 - NO DATA: SAME AS 111404-111405
- 111771 - GOOD: ALL OK - run rejected for other reasons above
- 111969-112001 - NO DATA
Additional comments on low statistics runs
run 110535 according to the log book the beam was off for quite some time and they did not stop the run. So the first files contain a lot of just cosmic triggers: logbook excerpt: 5:25 am End of run 110534. Start run 110535. 6:10 am Beam is back!! (was down for 20 minutes)
run 111206 is a 3 minute run, drop it!
run111290 is 20min run mostly cosmic, forget it! logbook says 09:20 No beam for last 15 minutes. Stop run 111290.
run 111430: 8 minute run forget it. logbook says: 11:22 Start the run 111430 11:30 MCC informed that they ran with same issue again while tuning up the beam so troubleshooting the issue continuously until it is resolved 11:30 Stop the run 111430, junked it,
ver14 monitoring launch
Note that this launch was performed before most of the above changes were made. Also, the SC geometry was fixed, but the calibrations were not updated yet.