File list
From GlueXWiki
This special page shows all uploaded files.
First page |
Previous page |
Next page |
Last page |
| Date | Name | Thumbnail | Size | User | Description | Versions |
|---|---|---|---|---|---|---|
| 09:18, 18 March 2011 | Tof lightguide20cm.pdf (file) | 4 KB | Zihlmann | a 200mm long light guide that tapers over 110mm from square cross section to circular cross section. | 1 | |
| 09:45, 10 March 2007 | Bendspec.gif (file) |  |
4 KB | Jonesrt | 1 | |
| 13:34, 29 January 2008 | Lgdeff.gif (file) |  |
4 KB | Jonesrt | 2 | |
| 18:24, 27 April 2009 | Mr-4-27-2009.gif (file) |  |
4 KB | Jonesrt | 1 | |
| 18:51, 6 April 2007 | Timewalk9.C (file) | 4 KB | Leverinb | 1 | ||
| 18:30, 27 April 2009 | Mr35-4-27-2009.gif (file) |  |
4 KB | Jonesrt | 1 | |
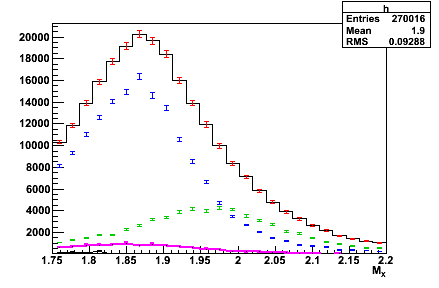
| 01:28, 21 August 2013 | Mattione Update 08202013 SlowPiPlus Event17 TruthHits.png (file) |  |
4 KB | Pmatt | 1 | |
| 15:52, 9 March 2012 | Eta bg log.png (file) |  |
4 KB | Somov | 1 | |
| 11:05, 9 July 2014 | Tof view-2.png (file) |  |
4 KB | Eugenio | 1 | |
| 10:54, 9 July 2012 | End30MeVsteps.pdf (file) | 4 KB | Sober | Endpoint region of fixed array with constant 30 MeV energy width; counter widths vary from 10.2 cm to 3 cm. (Circles are 1" PMTs.) | 1 | |
| 11:42, 19 December 2007 | Cd3at3deg.gif (file) |  |
4 KB | Jonesrt | 1 | |
| 23:19, 23 September 2015 | Mu decay e total.pdf (file) | 4 KB | Zisis | 1 | ||
| 18:30, 27 April 2009 | Mr42-4-27-2009.gif (file) |  |
4 KB | Jonesrt | 1 | |
| 23:21, 23 September 2015 | Mu decay e cell.pdf (file) | 4 KB | Zisis | 1 | ||
| 11:42, 19 December 2007 | Cd3at0deg.gif (file) |  |
4 KB | Jonesrt | 1 | |
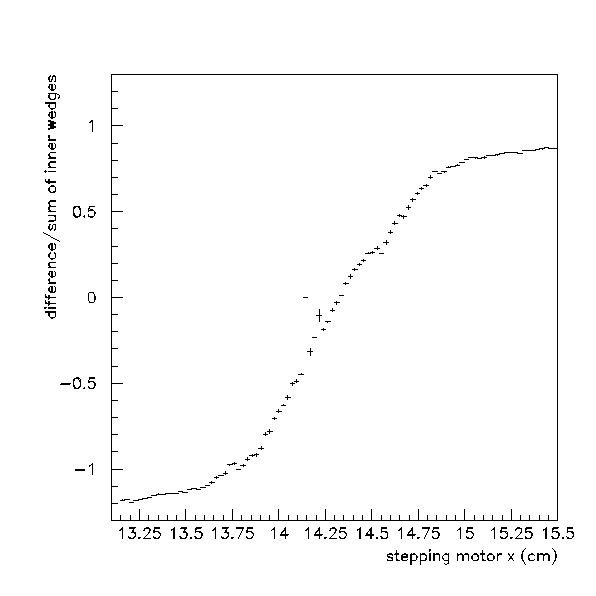
| 14:48, 31 October 2011 | Diffoversum.gif (file) |  |
4 KB | Jonesrt | 1 | |
| 18:29, 27 April 2009 | Mr20-4-27-2009.gif (file) |  |
4 KB | Jonesrt | 1 | |
| 11:42, 19 December 2007 | Cd3at6deg.gif (file) |  |
4 KB | Jonesrt | 1 | |
| 11:44, 16 January 2012 | Xfit hdg woOmegaLS.gif (file) |  |
4 KB | Senderovich | A b1pi fit to data generated with 2 coherent waves. The generated sample had the proper omega line shape while the fit amplitude had it relaxed (Gamma=200MeV). The magenta line shows the leakage to the uniform background wave - significantly reduced compa | 1 |
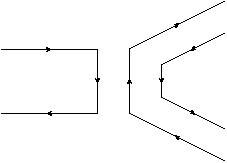
| 16:40, 20 April 2010 | Disconnected.jpg (file) |  |
4 KB | Cmeyer | Disconnected quark-line diagram | 1 |
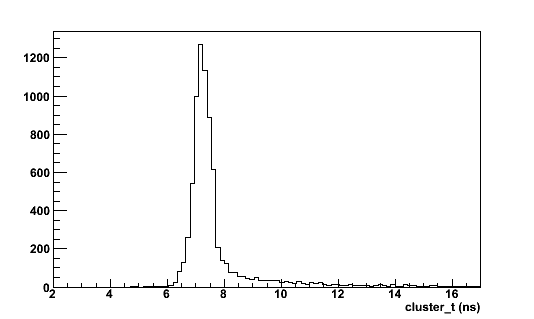
| 12:12, 25 June 2014 | Proton.cluster t.1000MeV 30deg.png (file) |  |
4 KB | Wilevine | 1 | |
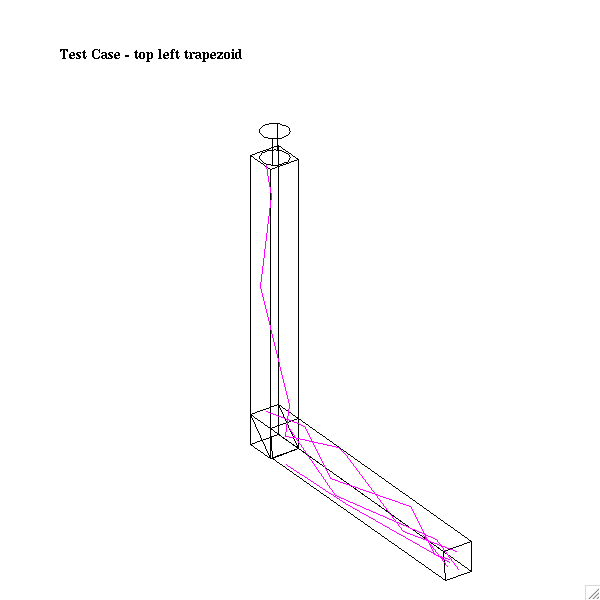
| 10:45, 4 January 2008 | Draw trigs trapezoid.gif (file) |  |
4 KB | Elton | Test 5.75,5.4 trapezoid | 1 |
| 05:46, 6 October 2010 | Ref DR 3x3.png (file) |  |
4 KB | Yqiang | 1 | |
| 18:28, 27 April 2009 | Mx20-4-27-2009.gif (file) |  |
5 KB | Jonesrt | 1 | |
| 01:16, 21 August 2013 | Mattione Update 08202013 SlowPiPlus Event3 TruthHits.png (file) |  |
5 KB | Pmatt | 1 | |
| 16:08, 11 November 2008 | PS Elect.png (file) |  |
5 KB | Jstewart | Electronics cartoon for pair spectrometer | 1 |
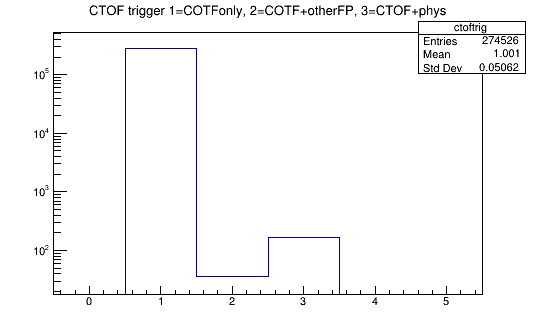
| 09:30, 7 December 2022 | Ctof triggers.gif (file) |  |
5 KB | Zihlmann | events with CTOF trigger only compared to COTF trigger with other triggers as well | 1 |
| 09:04, 11 February 2015 | Prob align no align.gif (file) |  |
5 KB | Staylor | 1 | |
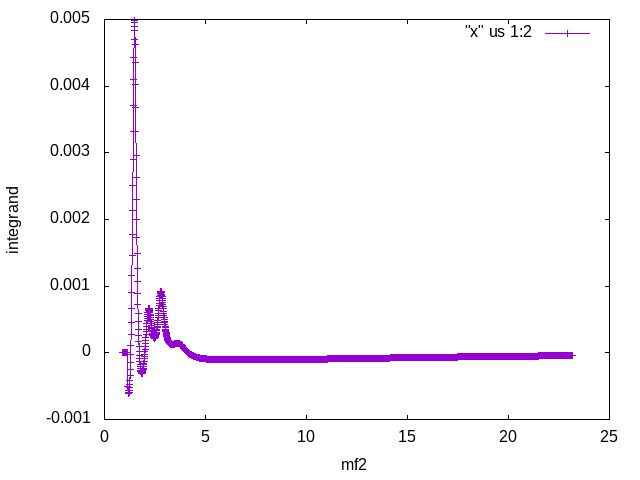
| 10:00, 26 May 2020 | Integrand.png (file) |  |
5 KB | Deurpam | BH integrant using Simula's SF parameterization | 1 |
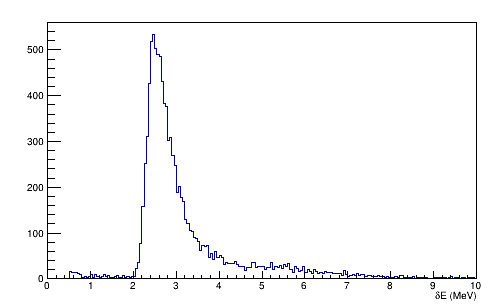
| 09:22, 3 November 2021 | Ctof dE1.png (file) |  |
5 KB | Staylor | 1 | |
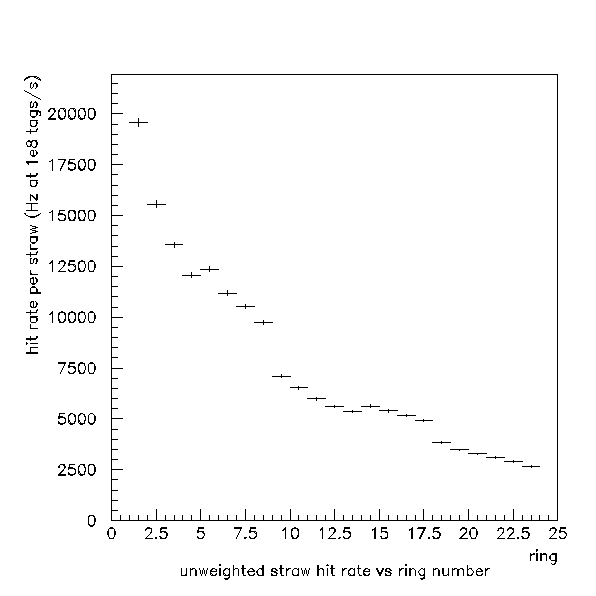
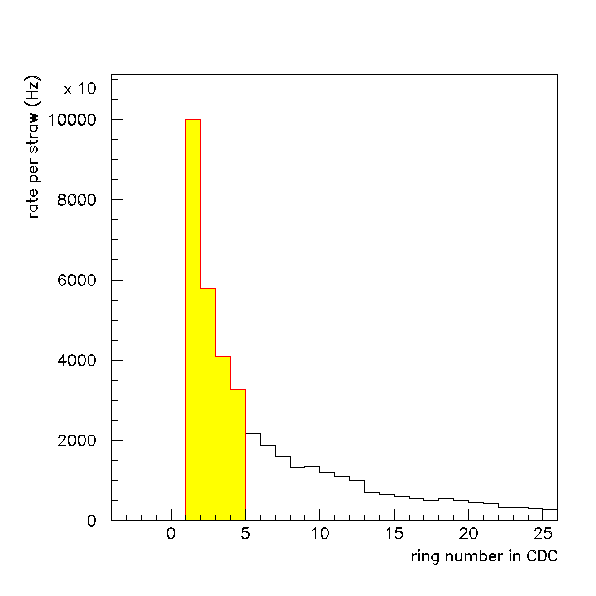
| 14:53, 24 January 2007 | Rings-nowt.gif (file) |  |
5 KB | Jonesrt | Unweighted histogram showing background rates in the CDC straws vs ring number, at nominal intensity of 10^8 tags/s. | 1 |
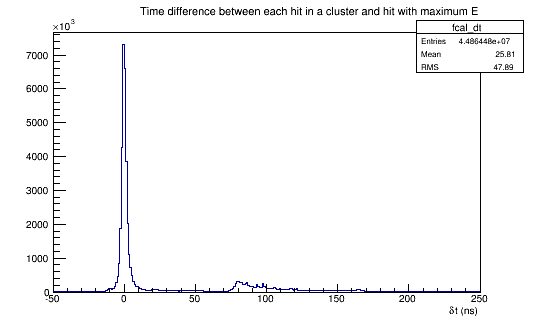
| 09:07, 1 July 2015 | Fcal dt cluster.gif (file) |  |
5 KB | Staylor | 1 | |
| 16:58, 18 June 2007 | Examp.gif (file) |  |
5 KB | Jonesrt | 1 | |
| 09:10, 5 September 2011 | Run 31710 5050 tfix1000 res.png (file) | 5 KB | Nsjarvis | 2 | ||
| 11:01, 26 August 2010 | Sipm width.png (file) | 5 KB | Yqiang | 1 | ||
| 15:52, 9 March 2012 | Eta bg lin.png (file) |  |
5 KB | Somov | 1 | |
| 09:28, 5 September 2011 | Run 31710 4951 tfix1000 res.png (file) | 5 KB | Nsjarvis | 3 | ||
| 18:50, 6 April 2007 | Time res2.C (file) | 5 KB | Leverinb | 1 | ||
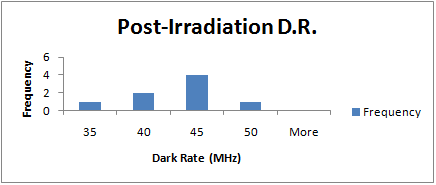
| 05:46, 6 October 2010 | Irr DR 3x3.png (file) |  |
5 KB | Yqiang | 1 | |
| 12:32, 4 September 2013 | Mattione Update 09042013 HDView2.png (file) |  |
5 KB | Pmatt | 1 | |
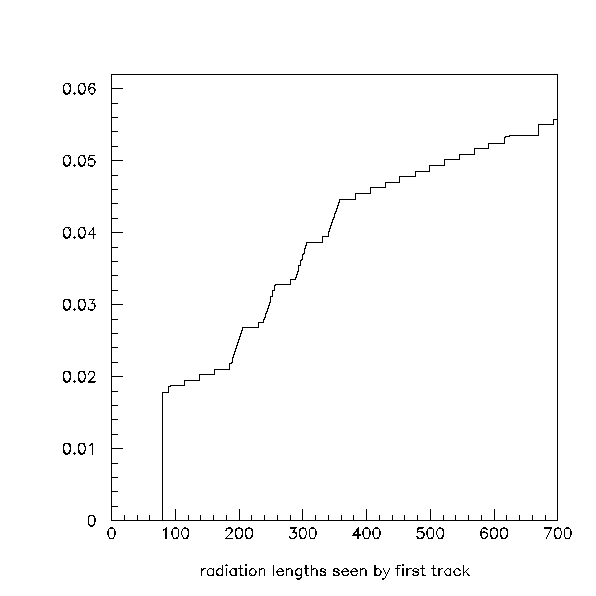
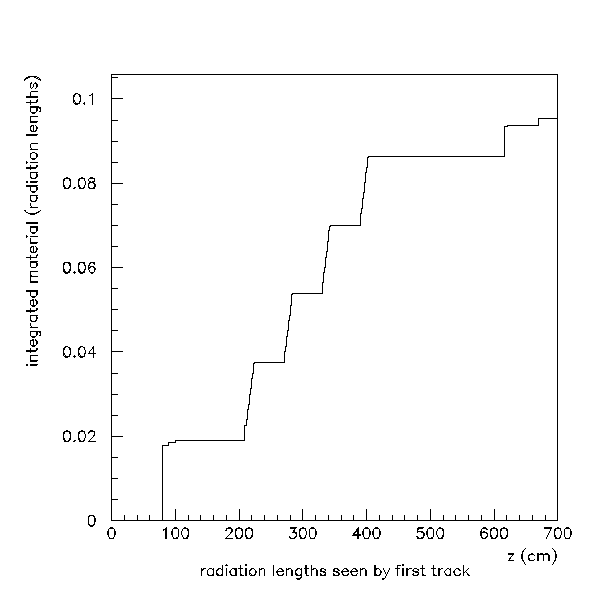
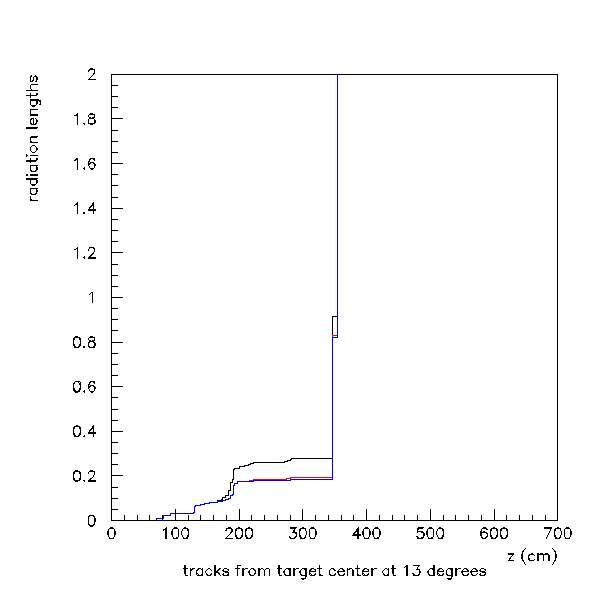
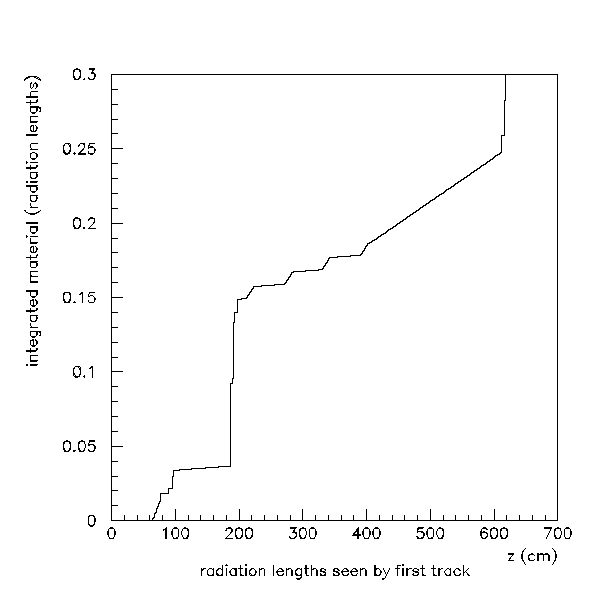
| 17:00, 13 June 2007 | Radlen-13.gif (file) |  |
5 KB | Jonesrt | 1 | |
| 17:13, 18 June 2007 | Examp-6-18-2007.gif (file) |  |
5 KB | Jonesrt | 1 | |
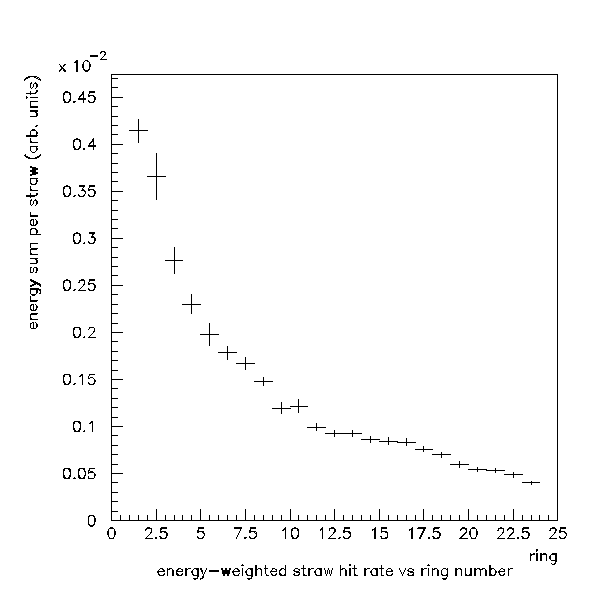
| 14:54, 24 January 2007 | Rings-wt.gif (file) |  |
5 KB | Jonesrt | Energy-weighted histogram of hit rate in the CDC straws (arb. units) vs ring number. | 1 |
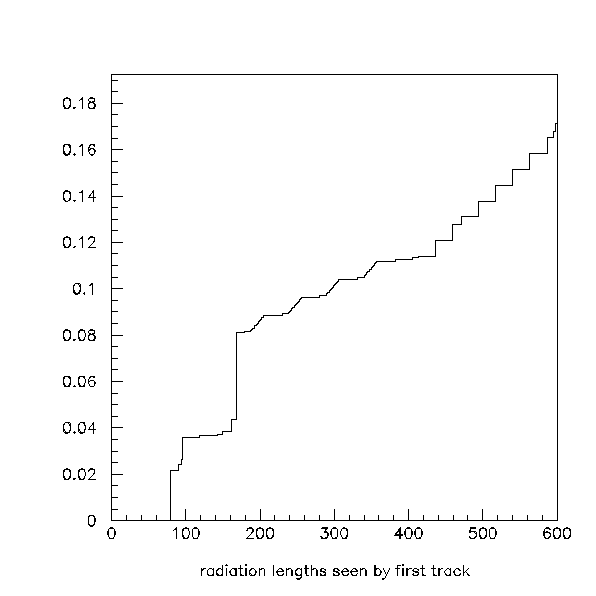
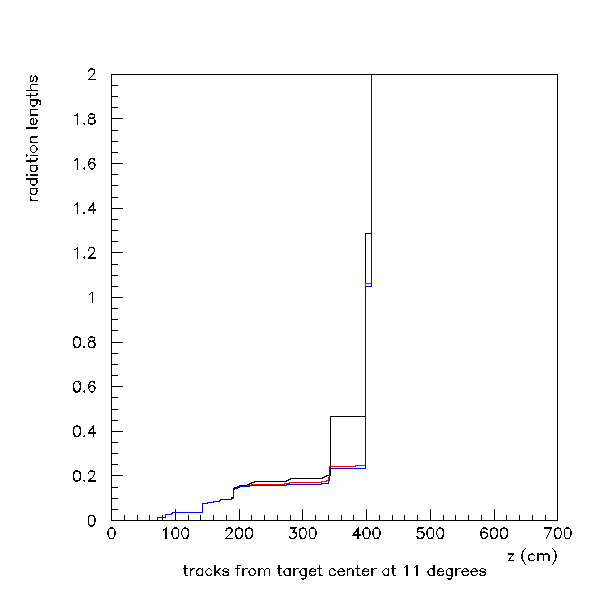
| 16:59, 13 June 2007 | Radlen-11.gif (file) |  |
5 KB | Jonesrt | 1 | |
| 09:11, 5 September 2011 | Run 31710 5050 tfix1000 res1mmplus.png (file) | 5 KB | Nsjarvis | 2 | ||
| 12:07, 18 June 2007 | 20070618 raw adc.C (file) | 5 KB | Davidl | ROOT macro used to produce plots of raw ADC spectra for run 2334 | 1 | |
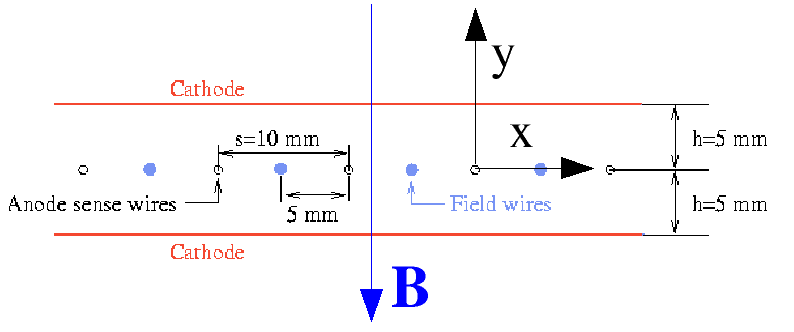
| 14:41, 22 May 2007 | Garf coord.gif (file) |  |
5 KB | Staylor | 1 | |
| 14:39, 22 May 2007 | Garf coords.gif (file) |  |
5 KB | Staylor | 1 | |
| 01:06, 21 August 2013 | Mattione Update 08202013 SlowPiPlus Event2 ReconHits.png (file) |  |
5 KB | Pmatt | 1 | |
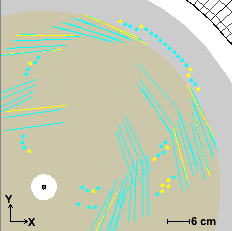
| 15:47, 6 February 2007 | 2007 02 06 cdcrates.gif (file) |  |
5 KB | Davidl | A plot of the CDC straw tube rates with 4 extra layers interior to the nominal design. This plot produced by Richard Jones, UConn. | 1 |
First page |
Previous page |
Next page |
Last page |