Test Setup for SiPMs
From GlueXWiki
Revision as of 11:27, 26 April 2011 by Yqiang (Talk | contribs) (→Test Items and Instruments Needed)
Contents
Test of First Article of Hamamatsu SiPMs at JLab
Time Line
- Mid Feb.2012: 10-20pcs partial shipment of first article units
- Mid Mar.2012: Delivery remainder first article units (60-70pcs)
- End Apr.2012: First article approval
- End Jul.2012: 1st delivery 500pcs
- End Aug.2012: 2nd delivery 500pcs
- End Sept.2012: 3rd delivery 120pcs
LabVIEW Programs and Data Directory
Directory
LabVIEW programs and acquired data are stored on sipm_pc.jlab.org in ARC building room 628.
- Directory for LabVIEW programs: C:\SiPM_Test\LabVIEW
- Directory for QDC data: C:\SiPM_Test\Data\QDC
- Directory for instrument's manuals: C:\SiPM_Test\Manuals
- Directory for instrument's drivers: C:\SiPM_Test\Drivers
LabView Programs
- DAQ_Control.vi
-
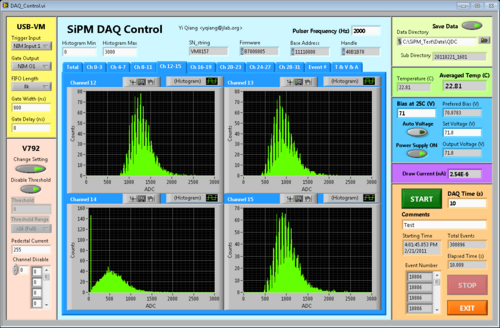
- Performs multi-channel DAQ with V792 VME QDC module
- Data saved in C:\SiPM_Test\Data\QDC and organized with directories named by the starting time
- Each directory contains the following files:
- Settings.txt: settings for the DAQ session
- Raw_Data.txt: raw data file of individual events of active channels, two columns: channel number, ADC channel
- Histo_xxx.txt: individual or stacked histograms of active channels, two columns: ADC channel (0-4095), count
- Readings.txt: readings of voltage, current and temperature during DAQ, five columns: relative time (s), set voltage (V), output voltage (V), draw current (nA), temperature (C)
-

- VI_Curve.vi
-
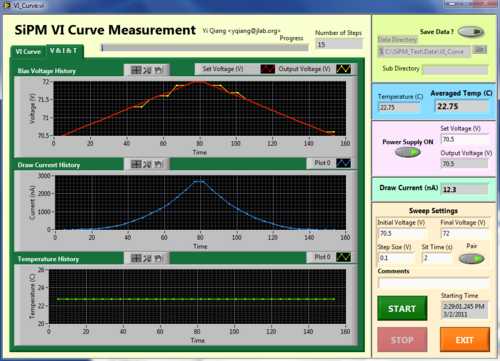
- Performs V-I curve measurement of SiPMs
- Data saved in C:\SiPM_Test\Data\VI_Curve and organized with directories named by the starting time
- Each directory contains the following files:
- Settings.txt: settings for the scan
- Data.txt: readings of voltage, current and temperature during measurement, five columns: relative time (s), set voltage (V), output voltage (V), draw current (nA), temperature (C)
-

Analysis Code
- replay.C
-


Test Results
- Protected web page for test results
- user name: halld
- SiPM sample#1: [1]
Test Items and Instruments Needed
General Devices
- Central Machine: SiPM_PC.jlab.org (129.57.72.17) Windows 7 computer with LabVIEW 2009 SP1 installed (USB)
- VME controller: Wiener VM-USB DLL Driver (USB to VME)
- QDC: CAEN V792 Example (VME)
- Oscilloscope: Tektronix TPO4104 Driver (RS232,USB,Ethernet)
- Temperature sensor: Go!Temp Driver (USB)
- Low voltage power supply: multiple output
- Bias voltage power supply: B&K 1787B Driver (RS232)
- Pulse Generator: HP 8116A Driver (GPIB)
- Picoamp Meter: Keithley 485 Driver (GPIB)
- Programmable Electrometer Keithley 617 Driver (GPIB)
Gain (being tested, 40/80 done)
- Measure ADC spectrum w. or w./o light source
- Measure distance between peaks, calculate the corresponding charge and then gain
Photo Detection Efficiency (PDE) (being tested, 40/80 done)
- Continuous method (DC mode): overestimated due to cross-talk and after pulsing
- Measure draw current with calibrated light input
- Divide current by gain and photon flux to get "PDE"
- Pulse mode
- Measure ADC spectrum triggered by calibrated pulse light source
- Fit the spectrum by the function derived here to extract detected number of photons and cross-talk/after pulsing
- Divide the detected number of photons by input to get PDE
Cross-Talk/After Pulsing
- Cross-Talk and After Pulsing are sometimes mixed, in this context they are defined base on the timing:
- Cross-Talk means fast secondary signals which happen almost simultaneously with the primary signal which are likely due to the secondary photon generated by the primary signal leaked to adjacent pixels.
- After Pulsing means slow secondary signals which happen after the primary signal which are likely due to the delayed release of trapped electrons.
- Threshold method
- Pure measurement with dark noise
- This method is mainly sensitive to Cross-Talk.
- Set threshold of counter at 0.5, 1.5 and 2.5 photon electrons, compare the rates at different rates to extract Cross-Talk.
- Formalism to extract cross-talk is still needed to be derived, effect of pile up and after pulsing needed to be taken into account.
- ADC method (being tested, 40/80 done)
- Same method as pulse mode discussed in the PDE measurement
- Flash method
- Use Oscilloscope or Flash ADC to record the time spectrum with very weak but instantaneous light input (laser for example),
- By comparing the shape of the time spectrum from the single photon events with all events to extract the after pulsing
- Such a method was discussed in SiPM radiation test
Irradiation Test
- Irradiated with RadCon AmBe neutron souce
- 2011/04/15 09:30 - 2011/04/19 09:40
- Total dose: 43.3 rem
- Temperature: 25 degreeC
- Sample: #1 and #3
- 60C nealing
- 2011/04/25 18:00 - 2011/04/27 10:00