Difference between revisions of "Tracked cosmic data"
From GlueXWiki
| Line 1: | Line 1: | ||
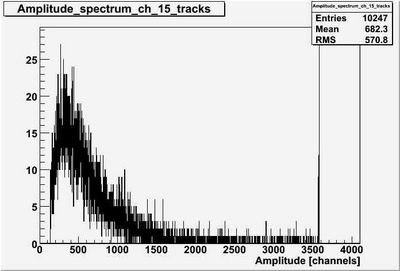
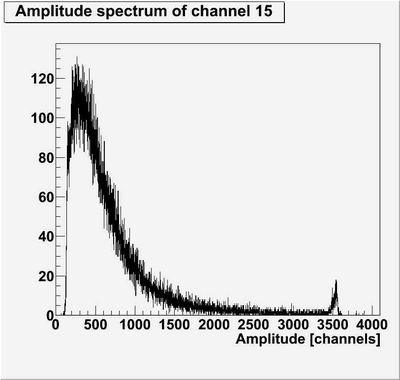
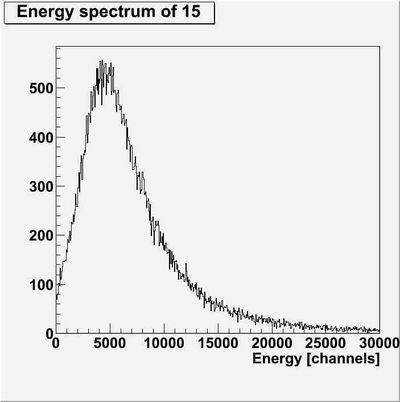
| − | The pictures below show ADC amplitude histograms for | + | The pictures below show ADC amplitude histograms for tracked and untracked cosmic ray data with 50/50 Ar/CO2 gas mixture (the maximum ADC amplitude for each event contributes one entry for that amplitude in the histogram) and energy spectra obtained by integrating the amplitude histograms. |
| − | + | ||
<br> | <br> | ||
Latest revision as of 22:11, 14 June 2010
The pictures below show ADC amplitude histograms for tracked and untracked cosmic ray data with 50/50 Ar/CO2 gas mixture (the maximum ADC amplitude for each event contributes one entry for that amplitude in the histogram) and energy spectra obtained by integrating the amplitude histograms.
These show data taken using the old preamp, GPC-01.
2050V - cosmics - amplitude, old preamp, tracked (left) and untracked (right)
2050V - cosmics - energy, tracked (left) and untracked (right)


