Online Monitoring Shift
Contents
The Online Monitoring System
The Online Monitoring System is a software system that couples with the Data Acquisition System to monitor the quality of the data as it is read in. The system is responsible for ensuring that the detector systems are producing data of sufficient quality that a successful analysis of the data in the offline is likely and capable of producing a physics result. The system itself does not contain alarms or checks on the data. Rather, it supplies histograms and relies on shift takers to periodically inspect them to assure all detectors are functioning properly.
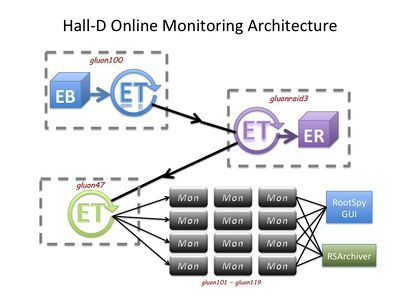
Events will be transported across the network via the ET (Event Transfer) system developed and used as part of the DAQ architecture. The configuration of the processes and nodes are shown in Fig. 1.
Routine Operation
Viewing Monitoring Histograms
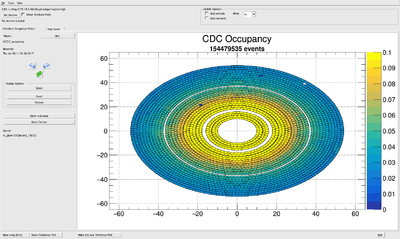
Live histograms may be viewed using the RootSpy program. Start it from the hdops account on any gluon node via the start_rootspy wrapper script. It will communicate with all histogram producer programs on the network and start cycling through a subset of them for shift workers to monitor. Users can turn off the automatic cycling and select different histograms to display using the GUI itself. An example of the main RootSpy GUI window can be seen in Fig. 2.
| Program | Action |
|---|---|
| start_rootspy | Starts RootSpy GUI for viewing live monitoring histograms |
In case rootspy histograms do not show follow the procedure under Starting and stopping the Monitoring System below
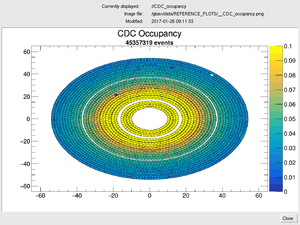
Viewing Reference Plots: Under normal operations, pages displayed by RootSpy are generated by macros. These may contain multiple histograms. Shift workers should monitor these by comparing to a reference plot. To see the reference plot, press the "Show Reference Plot" button at the bottom of the RootSpy main window. This will open a separate window that will display a static image of the reference plot by which to compare (see Fig. 3.). This window will update automatically as RootSpy rotates through its displays. Therefore, the reference plot window can (and should) be left open and near the RootSpy window for shift workers to monitor. For information on updating a specific reference plot, see the section on Reference Plots below.
Resetting Histograms: The RootSpy GUI has a pair of buttons labeled Reset and Restore. The first will reset the local copies of all histograms displayed in all pads of the current canvas. This does *not* affect the histograms in the monitoring processes and therefore has no affect on the archive ROOT file. What this actually does is save a copy in memory of the existing histogram(s) and subtracts them from what it receives from the producers before displaying them as the run progresses. This feature allows one to periodically reset any display without stopping the program or disrupting the archive. "Restore"-ing just deletes the copies, allowing one to return to viewing the full statistics.
IMPORTANT: Shift workers should either reset the histograms at the beginning of a new run or just restart the RootSpy GUI when a new run is started. This is because the RootSpy GUI will otherwise retain copies of histograms from the previous run. This does not affect the archiving utility as that is a separate program that is automatically started and stopped by the DAQ system. However, it may obscure developing issues from the shift workers.
E-log entries Shift workers should have RootSpy make an e-log entry once per run. This is done by pushing the "Make e-log Entry" button in the bottom right corner of the main RootSpy GUI window. Before pressing this, one should cycle through and examine all plots on all tabs. These entries are sent to the HDRUN e-log].
Restarting Monitoring Plots Occasionally the 'make E-log entries' stops creating entries in the log book. To re-enable making log entries, use the 'Start hdmongui' button on RootSpy and then 'Start Monitoring' button on the Hall-D Data Monitoring Farm Status gui.
Grafana Time Histories The Grafana website used by the RootSpy online monitoring system is now up and can be accessed at Grafana Online Monitoring
Event Viewer
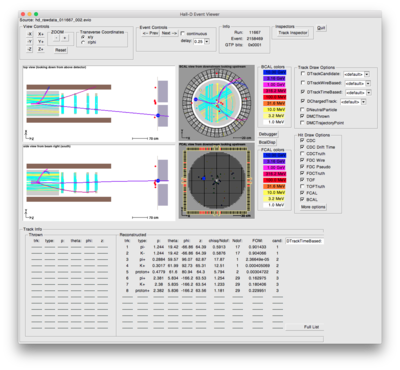
The single event viewer can be used by shift workers to monitor single events in the detector directly from the data stream. To start the event viewer and have it automatically connect to the live data stream just type start_hdview2.sh. Figure 4. shows an example of hdview2
| Program | Action |
|---|---|
| start_hdview2.sh | Starts graphical event viewer with the correct parameters to connect to current run |
Starting and stopping the Monitoring System
The monitoring system should be automatically started and stopped by the DAQ system whenever a new run is started or ended (see Data Acquisition for details on how to do that.) Shift workers will usually only need to start the RootSpy interface described in the previous section.
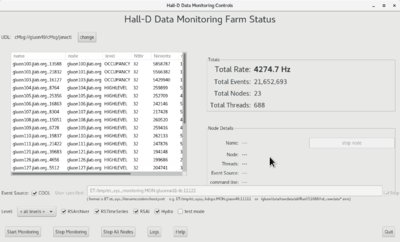
Shift workers may also start or stop the monitoring system itself by hand if needed. This should be done from the hdops account by running either the start_monitoring or stop_monitoring script. One can also do it via buttons on the hdmongui.py program (see Fig. 5.)
These scripts may be run from any gluon computer since they will automatically launch multiple programs on the appropriate computer nodes. If processes are already running on the nodes then new ones are not started so it is safe to run start_monitoring multiple times. To check the status of the monitoring system run the hdmongui.py program as shown in Fig. 5. A summary is given in the following table:
| Program | Action |
|---|---|
| start_monitoring | Starts all programs required for the the online monitoring system. |
| stop_monitoring | Stops all monitoring processes |
| start_hdmongui | Starts graphical interface for monitoring the Online Monitoring system |
One of the monitoring systems running is Hydra. Make sure this system is selected when starting the monitoring system. When selecting the "Level" also make sure that the checkbox for Hydra is marked.
Reference Plots
Detector experts are ultimately responsible for ensuring the currently installed reference plots are correct. The plots are stored in the directory pointed to by the ROOTSPY_REF_DIR environment variable. This is set in the /gluex/etc/hdonline.cshrc file (normally set to /gluex/data/REFERENCE_PLOTS). One can always see the full path to the currently displayed reference plot at the top of the RootSpy Reference Plot window along with the modification date/time of the file.
The recommended way of updating a reference plot is via the RootSpy main window itself. At the bottom of the window is a button "Make this new Reference Plot". This will capture the current canvas as an image and save it to the appropriate directory with the appropriate name. Moreover, it will first move any existing reference plot to an archive directory prefixed with the current date and time. This will serve as an archive of when each reference plot was retired.
Health of gluon cluster
The resource usage of the gluon cluster which includes not only the monitoring farm but the DAQ (i.e. EMU) computers and controls computers is monitored using ganglia. The ganglia web page is served by the gluonweb computer and is only accessible from the counting house network. Here is the link:
| Ganglia website |
|---|
| https://gluonweb/ganglia |
Expert personnel
Expert details on the Online Monitoring system can be here. The individuals responsible for the Online Monitoring are shown in following table. Problems with normal operation of the Online Monitoring should be referred to those individuals and any changes to their settings must be approved by them. Additional experts may be trained by the system owner and their name and date added to this table.
| Name | Extension | Date of qualification |
|---|---|---|
| David Lawrence | 269-5567 | May 28, 2014 |
| Alex Austregesilo | 383-2758 | 2020 |
| Sergey Furletov | 769-9755 | 2020 |
