Slow Controls Shift
Contents
Operator Interface Overview
The operator interface for Hall D control systems is based on Control System Studio or CSS. It allows the operator to use different important tools for EPICS from a single application. CSS is based on Eclipse RCP, and many features of CSS to the operator in the control room who already used Eclipse IDE will look and feel like Eclipse. For instance, there are Perspectives in CSS for running EPICS controls GUI, for defining and running strip charts for EPICS variables, for running an alarm handler. Most of the time the proper perspectives will already be open when a shift operator arrives at the shift or when an operator starts the EPICS controls or alarm screens.
Multiple control screens can be combined into a single CSS window as different tabs. Clicking on the tab in a view will activate the corresponding control screen. The tabs can be moved within a window or to a different window by clicking and dragging it into the desired location. One can also open a new empty window by selecting Window New Window menu item from the menu-bar of any of the CSS windows and drag the tab of one of the control screens into that new window.
To exit the current CSS session one needs to select File Exit from the menu-bar of any of the CSS windows. That will close all windows that belong to the same CSS session. When starting a new CSS instance all the window that were open just before exiting the CSS session will open. If one chooses to exit CSS by closing all CSS windows one-by-one using the window manager then only the window that was closed last will open when restarting CSS.
EPICS Control Screens
The EPICS display management system in Hal lD is based on Controls System Studio (CSS), namely on BOY package. To start the main control screen one needs to be logged into the gluon01 - gluon05 console machines in the Hall D control room and at the Linux prompt type either:
|HDOPS> gluex_css
or
|HDOPS> css_new
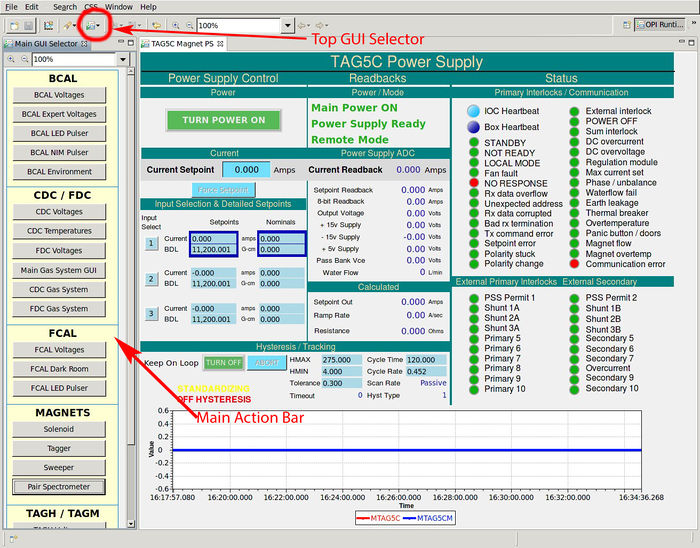
The Hall D controls screens are organized in a hierarchy of subsystems and components. The examples of subsystems are FDC,CDC, FDC etc. And each subsystem can have components such us Voltages, Gas etc. If the GUI you are looking for is not displayed you can open it using the main action toolbar by clicking on the Top GUI->MainActionBar button on the toolbar of any of the CSS window, see Figure 1. This should open a list of action buttons on the left side of the CSS GUI from which one can select which of the control screens one wants to launch by scrolling up and down the list of buttons. Clicking on any of the button on the main action bar will pop up a new window with the corresponding control screen. You can open other control screens using the widgets on the newly open window for the selected component.
If the the menu bar on the CSS screen is not visible so that you cannot click on the Top GUI->MainActionBar icon, it means that the CSS window is in Compact Mode. One needs to exit from Compact Mode to be able to see the CSS toolbar above the GUIs. To exit the Compact Mode for a particular window, one shall right click on a GUI in the CSS window and select Exit Compact Mode menu item from the drop-down menu. That CSS window should switch to the normal mode and the CSS toolbar should appear at the top of the window. At that point one should be able to find the Top GUI->MainActionBar icon.
Accelerator Screens
Sometimes it is useful to view EPICS screens of accelerator division. Accelerator division uses a different display management framework called EDM. Hall D shift personnel can access these EDM screens in read-only mode through the web-based WMENU by navigating to epicsweb.jlab.org. The page will ask for the users CUE username and password. This is the preferred way of accessing the accelerator division screens from Hall D counting house. There is a so called Standalone Menu for Hall D which contains read-only versions of the EPICS GUIs that accelerator uses to control and monitor systems related to Hall D, and it also contains the EDM equivalents of Hall D CSS screens under Other->Hall D Detector Components subsection of that menu. One can directly access the menu for Hall D detector components in WMENU that provides us with links to a select subset of the Hall D EPICS GUIs. These web pages with EPICS screens are accessible from both on-site and off-site computers.
Alternatively, Hall D shift personnel can launch the display management framework that MCC operators use called JMENU to find the accelerator control screens in EDM framework. In order to open JMENU on gluon machines, simply type
|HDOPS> jmenu
on a gluon desktop computer which will open a small window with menus. One can navigate to the desired screen by selecting the options in the menu or searching for screens by name. The JMENU screens are nearly identical to WMENU but they may be useful when the browser fails to properly render the EDM widgets. The disadvantage of the using JMENU is that it launches EDM server for a single Hall D user, and we get strange screen behaviour in Hall D counting house desktops. In addition, screens in WMENU are read-only while using JMENU can launch screens and applications that would allow users change parameters of the accelerator. Therefore, using JMENU is strongly discouraged in favour of WMENU and should only be used if there is a good reason not to use WMENU instead.
Detector Voltage Controls
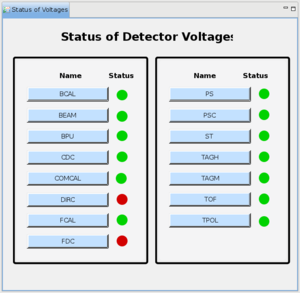
One can monitor the status from all detector voltages by opening the "Status of Detector Voltages" EPICS screen from the "GENERAL" section of the main action button bar of Hall D CSS screens. Clicking on "Status of Voltages" button will open an EPICS screen similar to one in Figure 2, showing all detector components voltage status. If the circle on the right is green then the voltage channels for the corresponding detector component are all on. If it is red, it means that not all the voltage channels for the corresponding detector component are on. Note that the color of the red circle is different from the alarm status in the Alarm Screens. Clicking on the button on the left will open the voltage controls screen for the detector component from where one can see more details about voltage channels of that particular subdetector and can turn on and off individual voltage channels or group of voltage channels. Shift personnel needs to follow the instructions on the subdetector operations page to know what to do if one or more channels of that subdetector are not on.
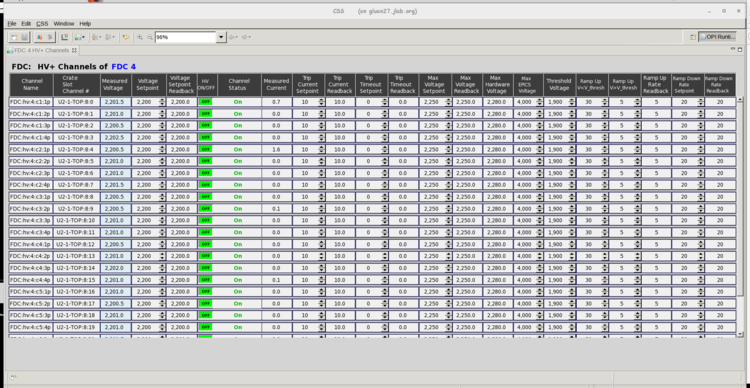
Different detector subsystems in GlueX use different hardware to control the voltages. Therefore controls screens for individual voltage channels differ detector to detector. Figure 3 shows the GUI for individual high voltage channels in FDC, each row representing an individual high voltage channel. Individual columns in the row of parameters is either a setpoint or a readback for a parameter. The column labeled "HV On/Off" is a binary button that allows one to turn on and off the voltage channel. If the button is green that means that the voltage channel is on, while red color means that channel is off. The label on the button show the action that will be attempted when the button is pushed at that moment. In the example in Figure 3, all channels are on as indicated by the green box, and pushing these buttons will turn the channels of, as indicated by "OFF" label on the green button. This convention is common for all binary buttons on GlueX controls GUIs. Often, when there is a voltage trip accompanied by an alarm, the first step recommended in the guidance is to reset the voltage channel by toggling it off and then back on. The "Channel Status" column next to the "HV On/Off" column shows the current status of the voltage channel as reported by the hardware providing the voltage. Although the yellow background on "Channel Status" column or a yellow frame around "HV On/Off" button indicates that there is some alarm condition for this channel, the Alarm Screen is what the shift taker should follow when interpreting if this condition needs attention or not.
The voltage parameters for most of the subdetectors can be saved and restored through an EPICS extension called BURT. The procedures are programmed in scripts that can be launched from the detector voltage control GUIs by selecting either SAVE or RESTORE option from the drop down menu, see Figure 4. When SAVE option is selected, a script will be launched that would pop up a small file selection window, and the current settings in EPICS will be saved to the file specified in the script GUI. When RESTORE is chosen, a script will be launched that would pop up a small file selection window, and the voltage parameters previously saved into the selected file will be loaded into EPICS and will be propagated into the hardware. Note, that ON/OFF state of the voltage channels are not saved as a voltage parameter, so loading parameters from a file will not turn any channels off or on, but it can change the voltage setpoint effectively turning channel off if the saved setpoint was zero. Saving and restoring voltage parameters should always be coordinated with the detector experts and not done by shift takers on their own initiative. It is strongly recommended to check the voltage settings after loading parameters from a file to make sure that procedure worked properly.
Data Browser / Striptooling
CSS has an integrated feature called Data Browser that allows users to display stripcharts within the same program where the controls screens are. As with the old EPICS StripTool, the CSS Data Browser allows one to create a file describing which EPICS variables need to be plotted in a give stripchart. Then one can open the desired file by a clicking a previously configured Data Browser file.
In addition, CSS Data Browser allows the user to create stripchart on the fly for the EPICS variable that one currently is monitoring on the CSS BOY screen. To start a stripchart, one needs to bring the mouse pointer to the desired EPICS variable and using righ-click select Process Variable Data Browser, This will open a stripchart in a separate tab in BOY and the time evolution of the EPICS variable will start being plotted. At this point there should be a visible toolbar on top of the strip chart that will allow the user to configure the properties of the stripchart, such as the axis limits, autoscrolling enable/disable, colors etc.
MYA Archiver
The archiving of Hall D EPICS variables is done using MYA archiver developed and maintained by the controls group of the JLAB accelerator divisions. It records the new values of the variable in a database whenever the new value differs from the most recent recorded value by more than the previously specified deadbands. At present time CSS and MYA are not integrated, and the archived data from MYA cannot be displayed on CSS screens. In order to view the history of an EPICS variables one needs to us myaPlot program developed and maintained by the JLAB accelerator software group:
- Determine the name(s) of the EPICS variables that one wants to view,
- Open the graphical viewer for MYA archiver called myaPlot by typing at Linux prompt
|HDOPS> myaPlot
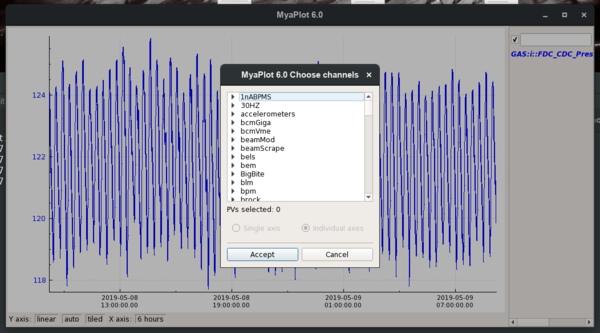
- Select the EPICS variables to be plotted by right-clicking on the text window in the upper right corner and selecting Browse option. The Hall D specific variables are typically kept in HD_* MYA groups, for instance HD_MAGNETS, HD_BCAL_TEMPS etc.
- myaPlot has very many useful features. For instructions how to use myaPlot please refer to the myaPlot User's Guide.
- The archiver has multiple "deployments" to optimize the performance of the system. The nominal deployment is ops deployment and it is where the current data is being stored. After a while, which could be multiple years, the "older data" get copied into the history deployment and eventually will not be shown on any client requesting the "older data" using ops deployment. MYA clients have options to switch between various deployments of MYA. When using history deployment , myaPlot will only display the "older data". Typically, if you do not need the data from the last year it may be better to use the history deployment . One of the downsides of using the history deployment seems to be that it works a little slower than when using ops deployment.
- Note that MyaViewer program has been deprecated and is not supported. The MyaViewer command now points to the myaPlot program.
- To bring up the standard set of current and beam position timelines, right-click on the blank space of the myaPlot screen that comes up and select "Load a Configuration." You may also want to right-click and convert to a LivePlot by selecting "Clone in new LivePlot."
There is also a separate program that looks very similar to myaPlot called livePlot. The main difference between the two programs is that livePlot shows the variables as they are seen in EPICS using ChannelAccess protocol, while myaPlot grabs the data from the MYA archiver. One can also have the history of a given EPICS variable or time slice tables be printed on the screen using command line tools like myget, myData, mySampler, myHistory. There is also a command line tool called myStats that allows to compute and printout the statistics on EPICS channel history stored in the MYA archiver. The full list of MYA utilities can be found on the MYA web site.
MYA also has web interfaces for drawing the EPICS variable timelines called WAVE and for retrieving numerical data from MYA in JSON format called myquery that are accessible both from on-site and offsite.
Alarm Handler
The EPICS alarm system is based on Controls System Studio (CSS), namely BEAST. To start the main alarm screen one needs to be login to the gluon01 console machines in the Hall D control room and at the Linux prompt type:
|HDOPS> gluex_css
The program for the alarm handling is the same as for the display management, therefore one can use the drop-down menu items on the alarm browser to open the control GUIs appropriate for a alarm condition. In general, the alarm screens mode can be replaced by the EPICS controls GUI mode by switching from OPI Runtime Eclipse perspective to Alarm perspective, and vice versa. In order to switch between Alarm and OPI Runtime perspective in the CSS menu bar click Window->Open Perspective->Other, and in the new pop-up window select Alarm (or OPI Runtime depending which perspective you want to switch to) and click OK button. If you do not see the menu bar on the CSS GUI, you are probably in the "Compact Mode". In orderto toggle "Compact Mode" on and off use F8 keyboard button when pointing on the CSS GUI or use the drop-down menu that shows up when one right-clicks the mouse on the CSS GUI.
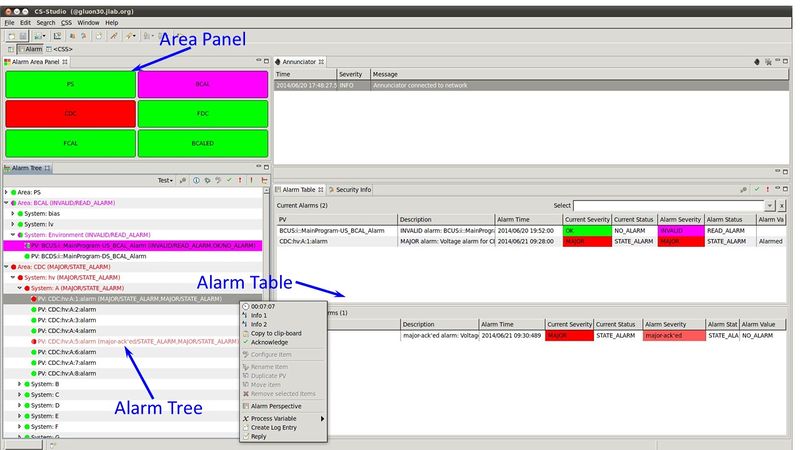
The alarm perspective of CSS consists of three key views: Area Panel, Alarm Tree and Alarm Table. Area Panel shows which subsystem of GlueX detector is in a normal condition and which subsystems contain alarming EPICS variables. Alarm Tree view allows one to browse the alarm hierarchy tree to find the variables that are in alarming state. Each node on the Alarm Tree has a menu that can be accessed by right-clicking on the node on the tree. The menu may have a selection options for acknowledging the alarm, for information and guidance, and for opening related displays. The shift personnel needs to read all of the information items marked by i on the left side to get more information about the event and to get guidance on the possible actions that may be required to solve the problem at hand.
The channels and the branches of the trees normally should be green which means there are no alarms. The red color indicates that there is a major problem that needs immediate attention. The yellow color alarm is designated for problems that are not very critical, but the they still need to be attended too. The barbie-pink alarm indicates a problem with the signal in the control system (read/write alarm, lost connections, EPICS IOC crash, etc) and needs to be addressed immediately similar to the red alarms.
Shift personnel should take actions suggested by the information/guidance menu items and only after that acknowledge the alarm. The acknowledgement should be done on the lowest alarming branch on the tree to avoid sending unnecessary spurious notifications for "OK" alarms to the on-call personnel. Acknowledging an alarm will move the corresponding line in the Alarm Table from the Unacknowledged Alarms panel to the Acknowledged Alarms panel. The line will disappear from the Acknowledged Alarms panel in the Alarm Table once the alarming condition goes away. If the same EPICS variable alarms again, the corresponding line in the Acknowledged Alarms panel will move back to the Unacknowledged Alarms panel, in which case the shift personnel should repeat the actions suggested by the guidance unless the information screen explicitly suggest a different set of action for repeated alarms. Only when an appropriate action is taken by the shift personnel (or by detector experts if present) the alarm should be acknowledged, acknowledging alarms does not take any action by itself, it simply tells the alarm system that the alarm has been noticed and the problem is being addressed or has been addressed.
Input/Output Controllers (IOC-s)
All EPICS variables that are visible on the control and monitoring screens in Hall D counting house are
provided by server programs running on different Linux machines, including VME/VXS controllers.
It is important that all EPICS IOC are running properly. If these process die
then the shift operator sees the "Disconnected" over a magenta background instead of usual values of the
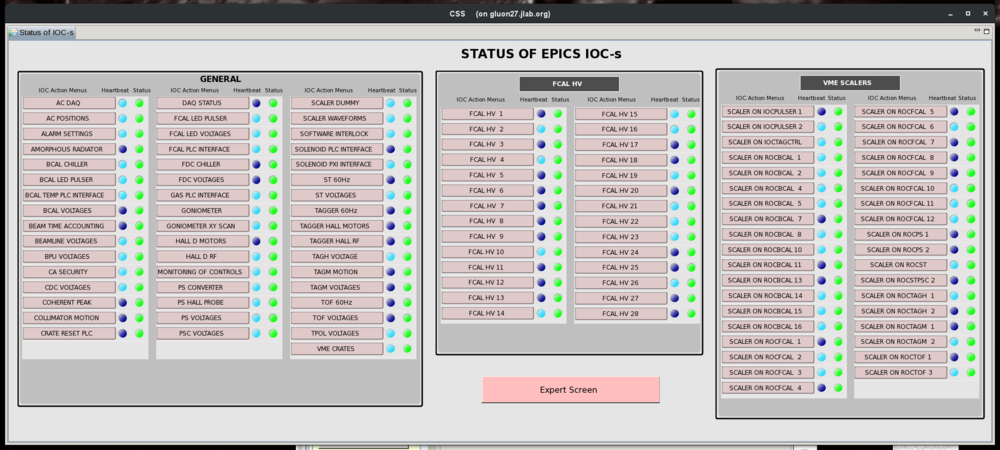
EPICS variables. There is a special EPICS GUI that allows to monitor the status of all Hall D EPICS IOC-s, where one
can see the heartbeat LED for each of the IOC-s. In the normal condition the LED for each LED should be blinking and
not be static and the status LED should be green. If any of the EPICS variables on the controls screens shows "Disconnected" message more than a minute or
any of the LED on the IOC heartbeat GUI is static for more than a minute the shift personnel should call the slow controls expert.
Because sometimes it is heart to spot a static heartbeat LED when the others are blinking the status LED next to the heartbeat LED should turn red if the hearbeat stops.
In addition, if any of the variables served by a dead IOC is present in the alarm configuration an alarm will be audible and visible in the alarm handler. Usually a failure of a single IOC will lead to a large number of channels triggering "Disconnected" alarm. In case any of the disconnected alarms continues more than a minute the shift operator should contact the slow controls expert. GlueX shift personnel is not expected to identify which IOC needs to be rebooted unless the guidance information in the alarm handler,a detector expert, or the operators instructions for one of the other GlueX systems explicitly specify that a particular IOC needs to be rebooted.
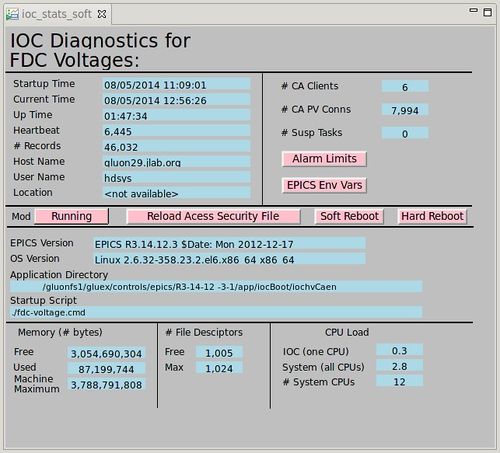
If the shift personnel is instructed to reboot an IOC by the expert, they can do it from the EPICS GUIs. It is important that the shift personnel DOES NOT REBOOT EPICS IOC without instructions from the slow controls expert since rebooting some of the IOC-s can have serious consequences and loss of beam time. In order to reboot an IOC one needs to bring up the IOC heartbeat EPICS GUI, shown in Figure 7. Select the desired IOC in the list of the IOC by left-clicking on it. A drop-down menu will appear where one needs to select the item called View Status of IOC ... . A new window will pop up showing statistics for that IOC, Figure 8. Click Soft Reboot button to reboot the IOC. The fields in the new GUI will become disconnected for a short time (turn pink) until the IOC is booted and is back online. This should take about 20 seconds. If the soft-reboot fails you can try to click Hard Reboot button to reboot the IOC. If these steps do not help, contact the controls expert again for more help.
Cameras in the halls
In order to be able to see the status of the systems in the halls that are not electronically controlled and monitored we installed a set of video cameras in the halls. Most of the cameras allow to zoom in and out. Some of the cameras allow the user to pan in/out and manually focus. In order to view a specific camera, click on the Cameras button in the General section of the main action button bar which should open another button panel. Clicking on the buttons on that panel will open a browser window with view for the specified camera in the hall. The list of the cameras installed in the Hall D complex is given below. One can navigate to the liveview of a specific camera by pointing his/her browser running locally on the gluon cluster to the hostname column given in the list of cameras below.
| Name | Hostname | Comments |
|---|---|---|
| Hall D view from the east wall | halldcam3.jlab.org | Installed by Walt Akers |
| Hall D view from the west wall | west-cam.jlab.org | Hall D PTZ camera |
| Solenoid rack view from the north wall | north-cam.jlab.org | Hall D PTZ camera |
| FCAL rack view from the south wall | south-cam.jlab.org | Hall D PTZ camera |
| TAC camera in Hall D | tac-cam.jlab.org | Hall D PTZ camera |
| Goniometer camera in tagger hall | goni-cam.jlab.org | Hall D fixed camera |
| Gas system camera on upstream platform | gas-cam.jlab.org | Hall D PTZ camera |
| Alcohol bubbler camera in the gas shed | shed-cam.jlab.org | Hall D PTZ camera |
| Left white board camera in the control room | left-cam.jlab.org | Hall D fixed camera |
| Right white board camera in the control room | right-cam.jlab.org | Hall D fixed camera |
| Spying camera in the control room | halldch-cam.jlab.org | Installed by physics division |
Expert personnel
The individuals responsible for the Slow Controls are shown in following table. The first point of contact during problems with Hall D slow controls is the Slow Controls Expert. In case the Slow Controls Expert cannot be reached, some individual experts might be available to resolve various issues. Problems with normal operation of the Slow Controls System should be referred to those individuals and any changes to their settings must be approved by them. Additional experts may be trained by the system owner and their name and date added to this table.
| Name | Extension | Date of qualification |
|---|---|---|
| Slow Controls Expert | 757-383-3599 | July 7, 2014 |
| Hovanes Egiyan (EPICS) | 757-660-1198 | July 7, 2014 |
| Bobby Bunton (PLC) | 757-660-0017 | September 19, 2022 |
