BCal Beam Test Plots, April 6, 2007
This page describes the study of run 2440 (the root file for run 2334 is in the process of being generated). The reference timing for the BCAL has been corrected (" I finally found the bug that was causing the problems in the BCAL timing. It was in the code that determined the reference time to subtract off of the TDC value. " -David Lawrence) and I've rerun the analysis used in the BCal Beam Test Plots, April 4, 2007 plots with the difference being that the tagger is used as a reference for the BCAL. Looking at cells 7,8 and 9 we can see a remarkable improvement though there are those 4 nasty little bumps, possibly from missing t-counters.
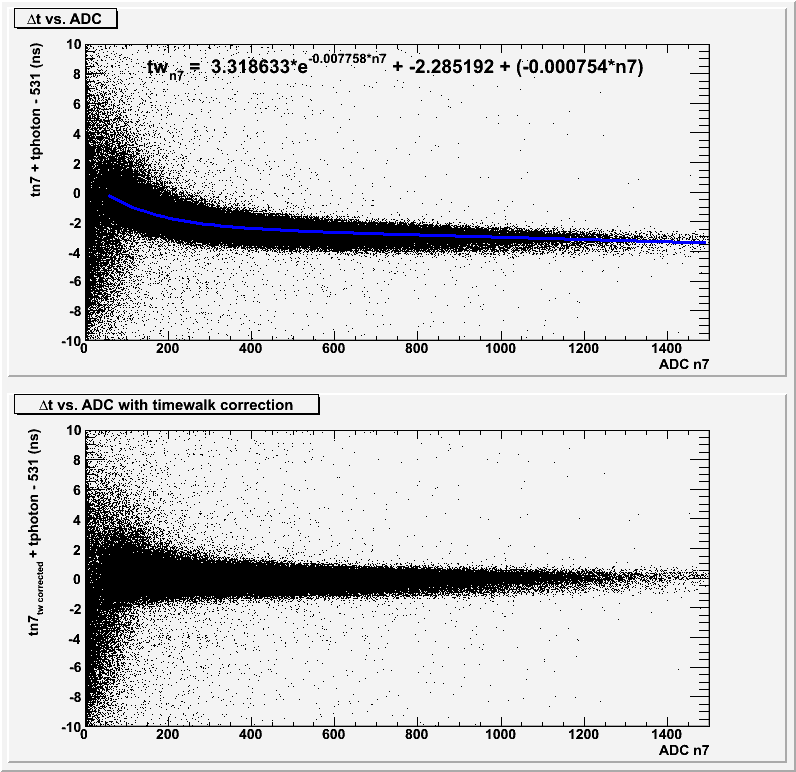
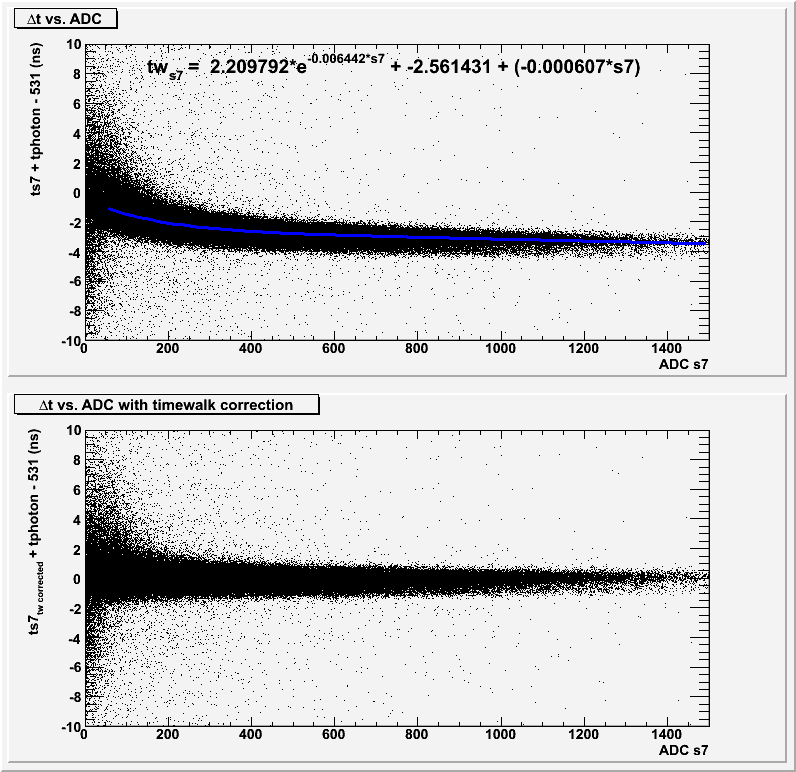
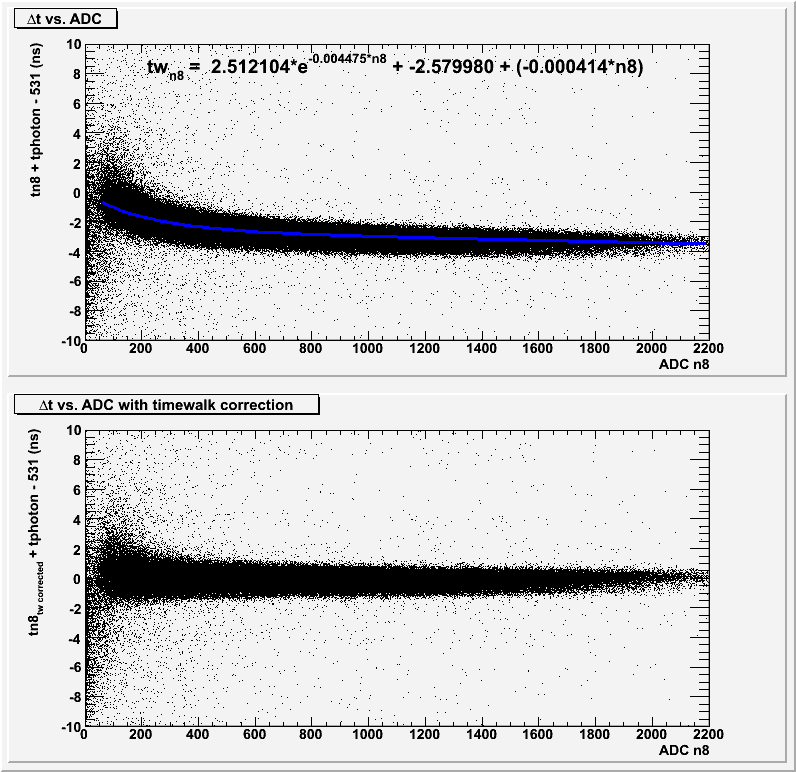
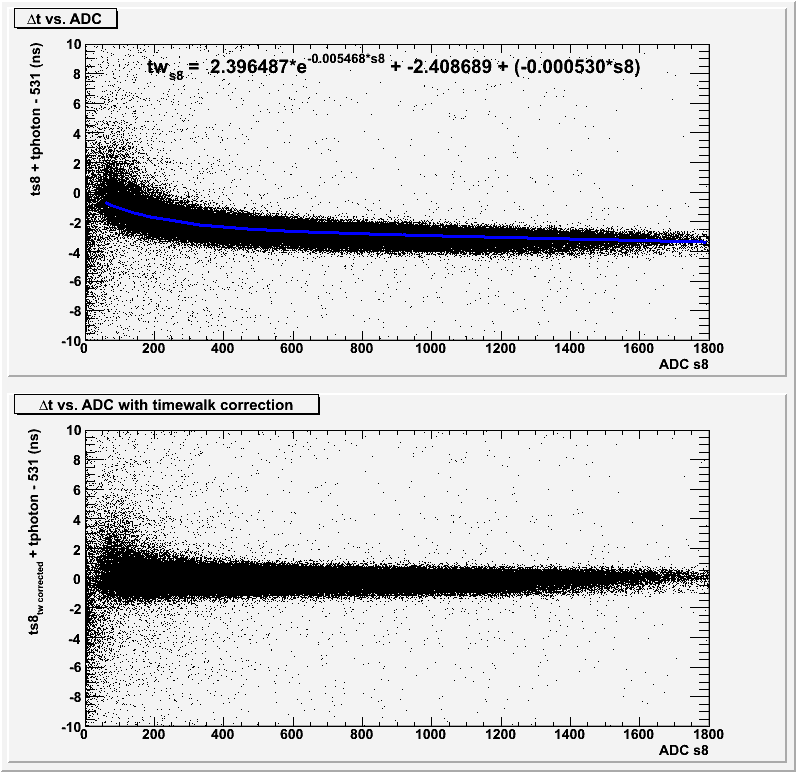
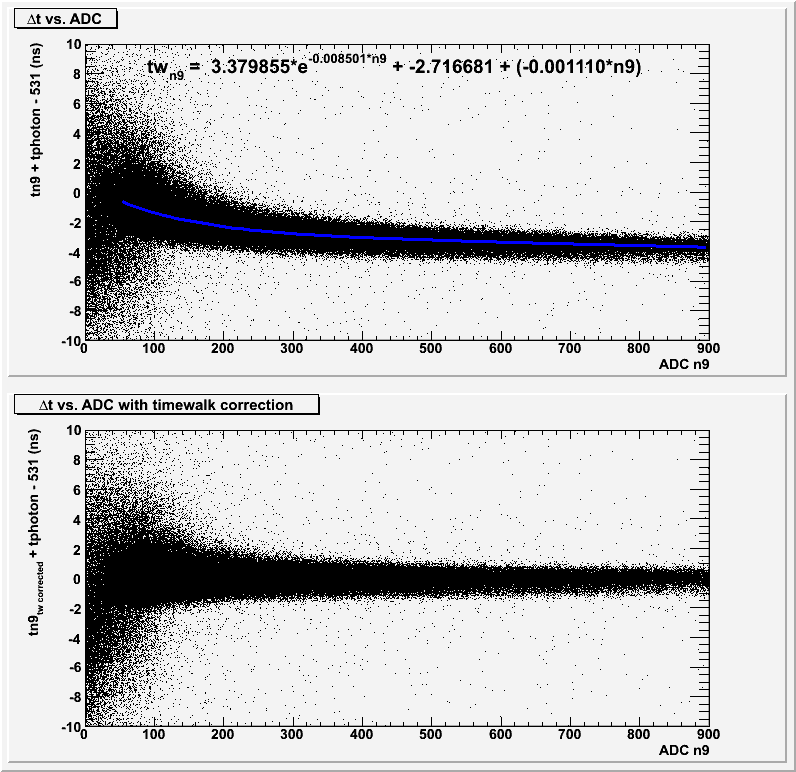
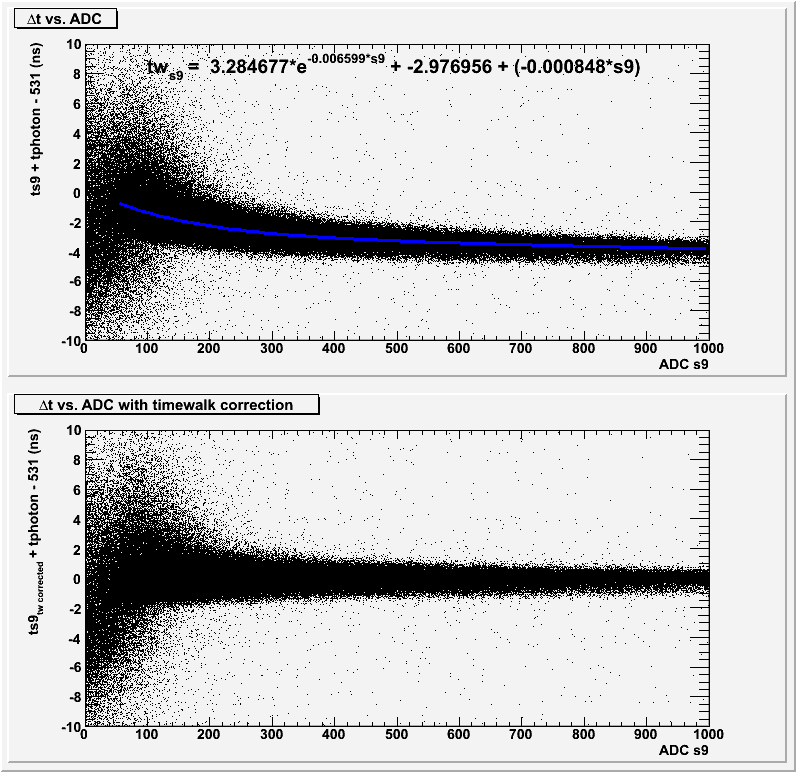
Timewalk
N7
Timing Resolution
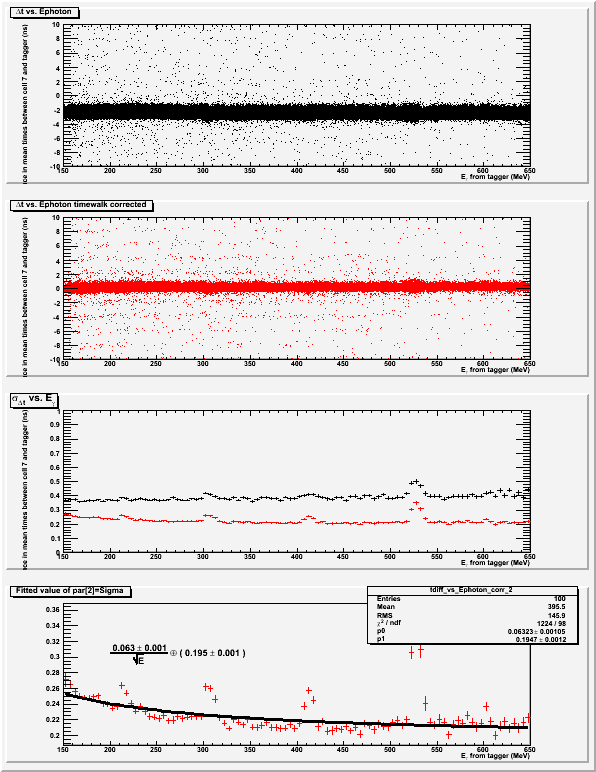
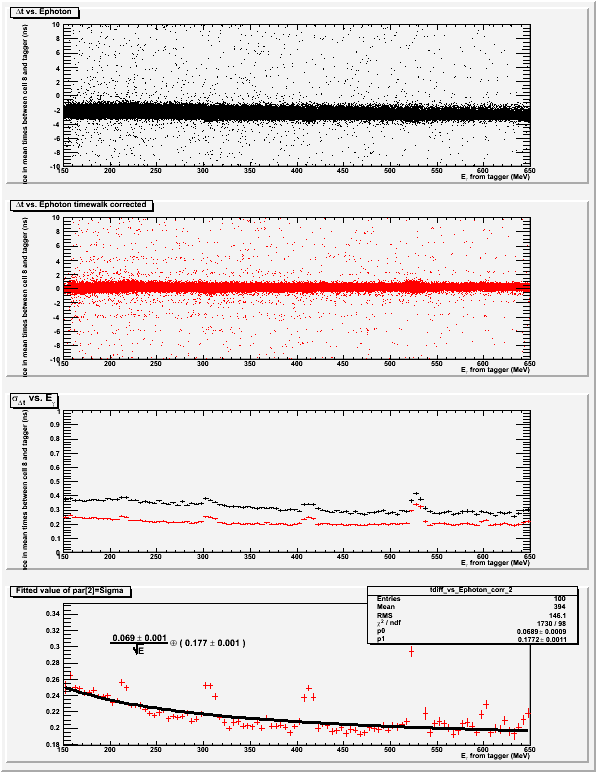
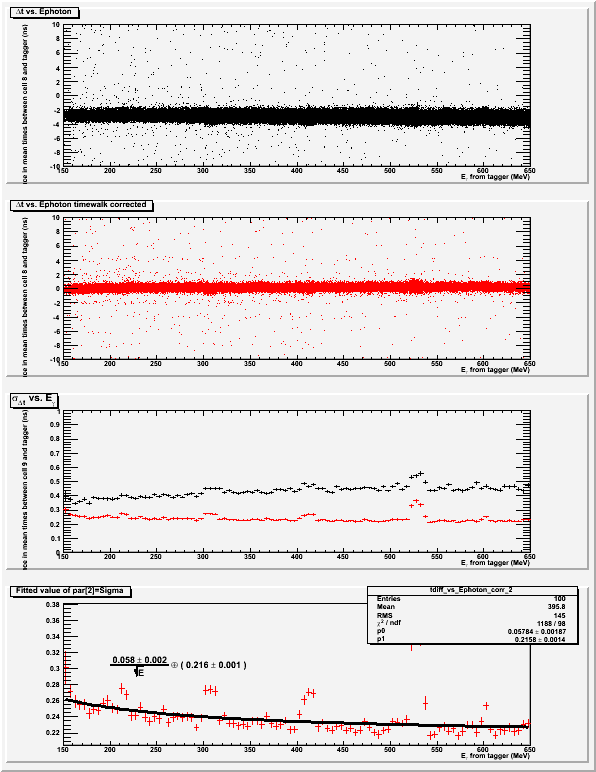
In the 4 plots in each of the 3 images (BCAL cells 7,8 and 9) that follow, the time difference between the mean times of cell7 and cell 8 are shown as a function of photon energy as reported by the tagger.
(tn8+ts8)/2.0 + tphoton - 531
The top plot (black dots) has no timewalk corrections applied.
The 2nd plot (red dots) has the timewalk correction functions applied to each of the tubes.
The 3rd plot shows the sigmas resulting from fitting slices of the top 2 histograms to gaussians for each x-bin. This indicates the timing resolution as a function of incident photon energy with(red) and without(black) timewalk corrections applied to each of the TDC signals.
The bottom plot is a fit to the 3rd plot(red dots) fitting the function
sqrt( (p0/sqrt(E[GeV]))^2 + (p1)^2 )
One can see easily see 4 humps in the resolutions and the times differences if you look closely. These are currently a mystery to me.
Here are the ROOT macros used to make the above plots:
