BCal Tagger timing, June 19, 2007
Tagger timing relative to BCAL
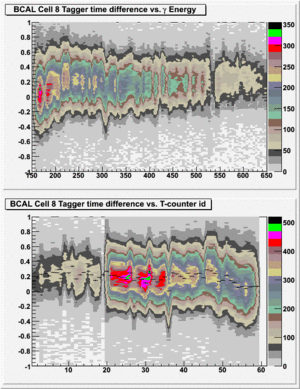
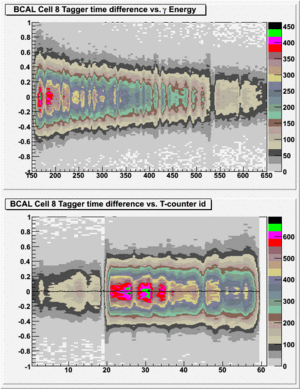
The plots below show the time difference between the tagger and the mean time of BCAL cell 8. The top 2 plots are the time difference vs. energy of the incident photon (as measured by the tagger). The bottom 2 plots are the same events, but plotted vs. T-counter id. Note that lower T-counter id corresponds to larger photon energy. The plots on the left were made using the original tagger calibration which used the veto as the reference time. The 2 plots on the rght were made using the refined tagger calibration which used the timewalk corrected mean time for BCAL cell 8 as the reference.
| Before hi res tagger calibration | After hi res tagger calibration |

|

|
Intrinsic Tagger Timing
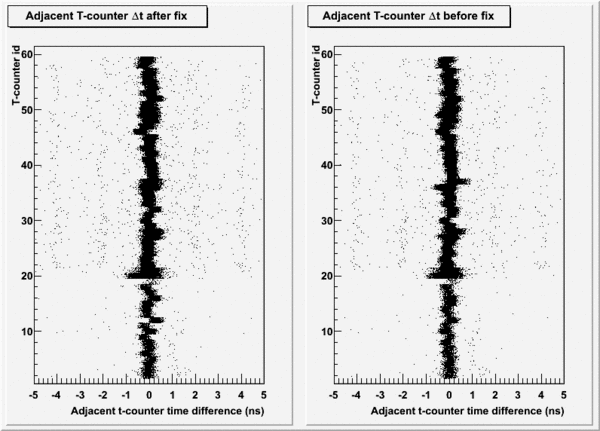
To measure the intrinsic timing of the tagger, we look at coincidences between adjacent T-counters. Since the T-counters overlap by about 10% on each side, there are a number of eventts in which the same electron ws measured by two counters. The first pair of plots below show the T-counter id (y-axis) vs. the adjacent T-counter timing difference(x-axis).
Note that the plot on the right is before the refined tagger calibration described above. The left plot is after the correction. It is not currently understood why the timing relative to the BCAL is nicely lined up, but the counter-to-counter timing is not.
Compare these to Simon's logbook entry dealing with the same thing,
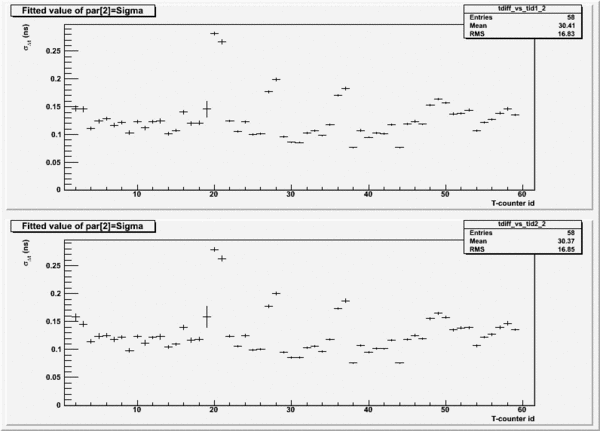
The next 2 plots show the standard deviations of the above 2 plots as a function of T-counter. They clearly show problems with counters 20, 27, 36, and possibly 49. Also interesting is that the counter-to-counter timing resolution is approximately 120-130ps, siginifcantly lower than the 160ps we currently assume.

