CDC 06 02 2008
Contents
1 News on the noise issue
Inspired by Gerard's visit and equipped with his differential probe I had a first look at a non-oscillating preAmp. I put 1900 V on the straws and checked all connected straws and they are all looking good (= I see signals). Time to do some additional noise studies.
Setup:
*) 16 armed straws
*) HVDB (HV distribution board) that Gerard brought with him
*) new preAmp, also the one the Gerard brought with him
*) 1.5 meter cable + differential probe (which attenuates the signal 0.366x) (NO shaper) + scope
The VME crate was switched off, the only thing on (within a radius of 10 m) was a PC and a NIM crate.
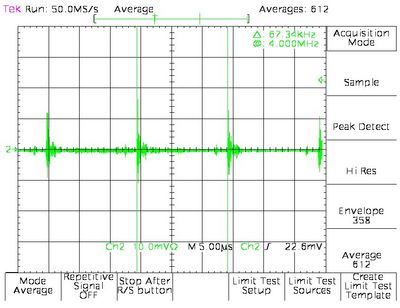
I took a first look at the noise on a random straw (shown in figure 1.1):
Pickup with a frequency of 67.80 kHz can be observed. It was coming from a CRT computer screen, so that was switched off.
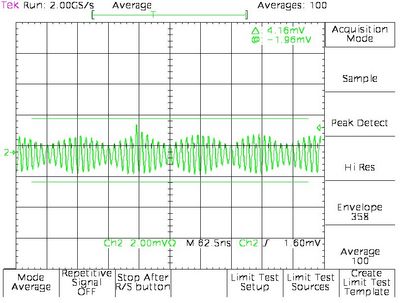
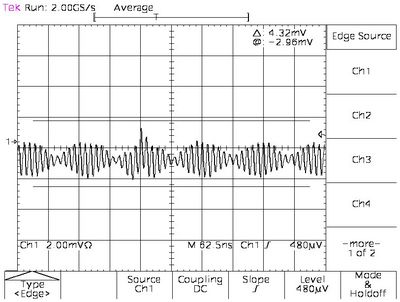
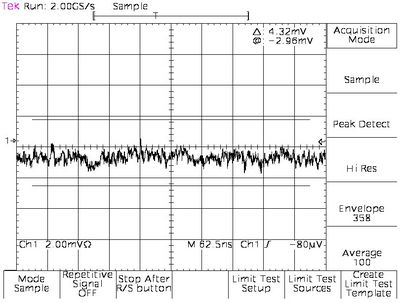
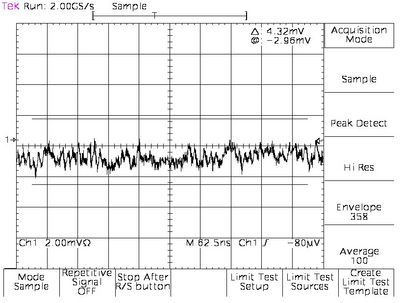
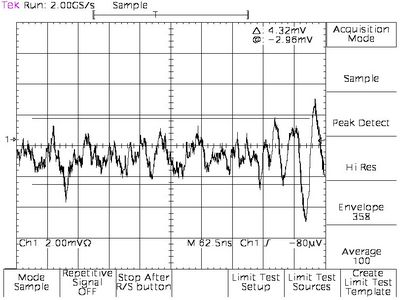
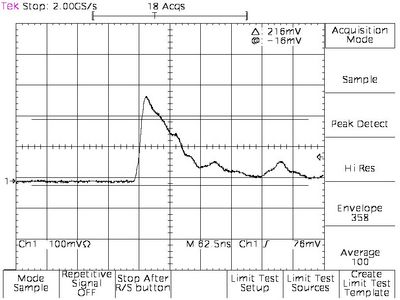
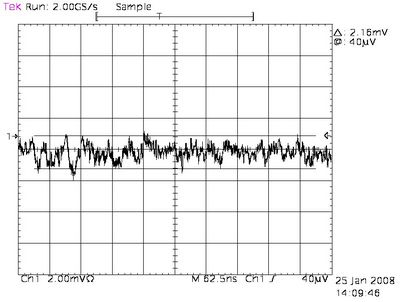
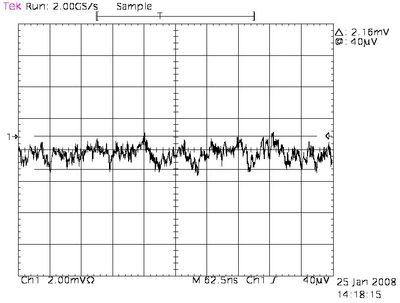
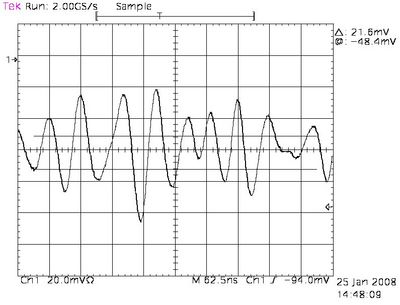
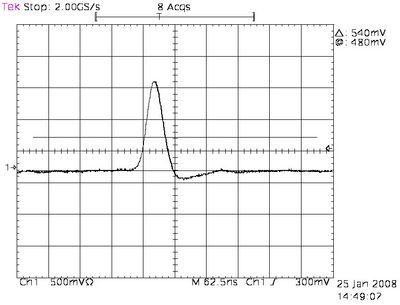
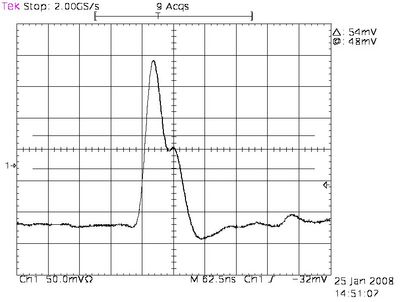
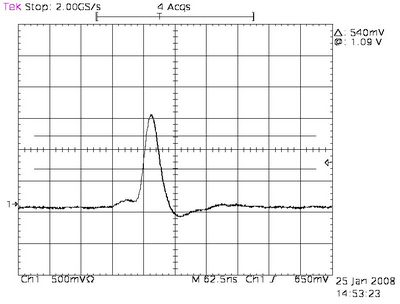
For further studies i selected 4 typical channels/straws: i will call them straw 1,2,3, and 4. The scope traces of these channels (respectively) are shown in figure 1.2-1.5:
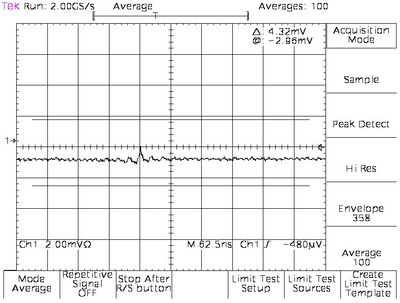
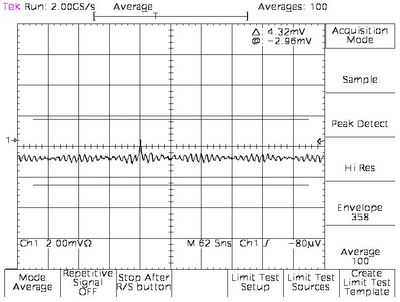
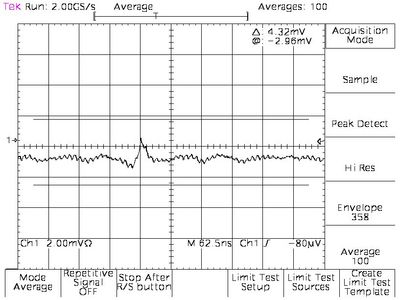
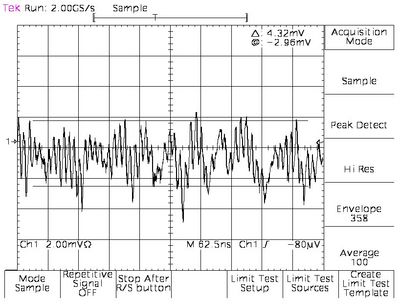
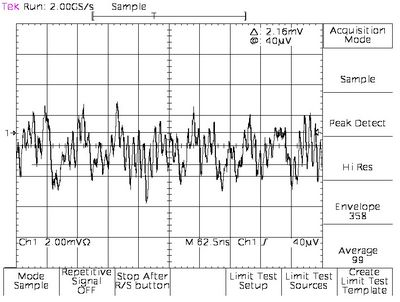
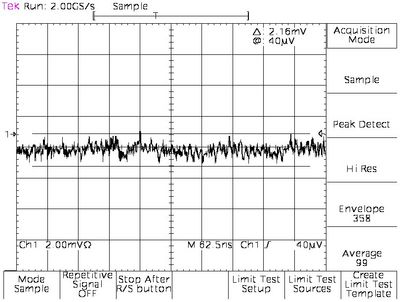
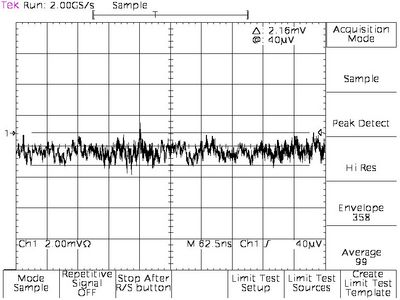
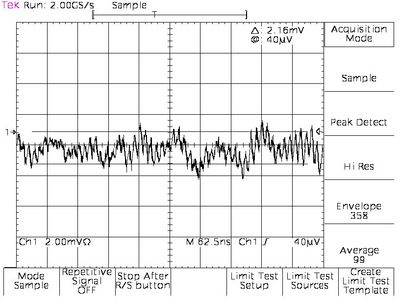
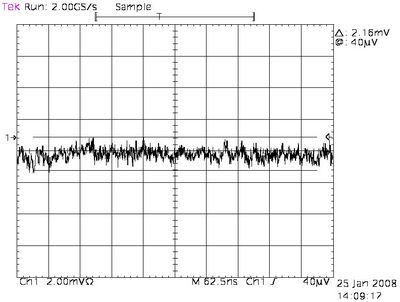
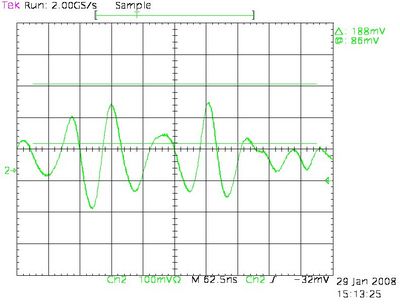
The noise is what it is, this is our starting point. After trying out some things I put Al-foil over the upstream plenum + HVDB. I had most success when the foil was touching the cooling strip of the new preAmp. When the foil was touching the grounding of the cable (between preAmp and differential probe) I saw the preAmp oscillating??? again (forgot to take traces of that one, sorry). The scope traces of the noise are shown in figures 1.6-1.9 (for straw 1-4 respectively).
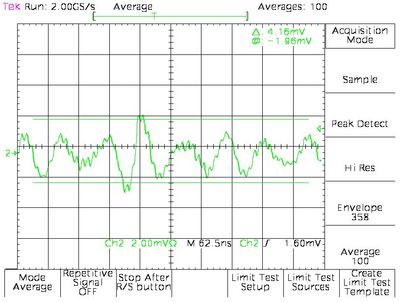
These traces are averages, the sample traces are shown in figures 1.10-1.13
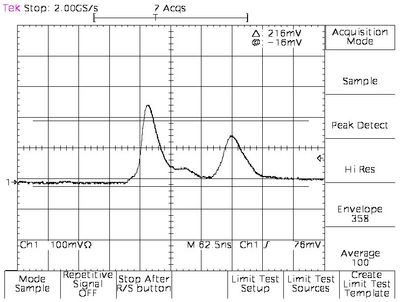
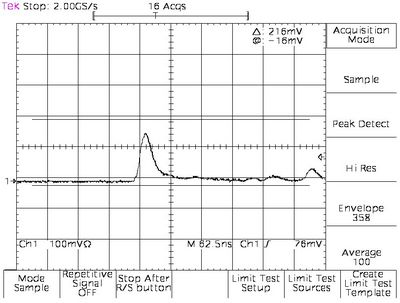
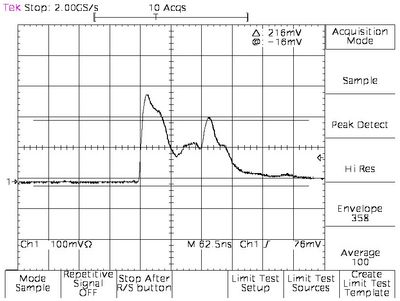
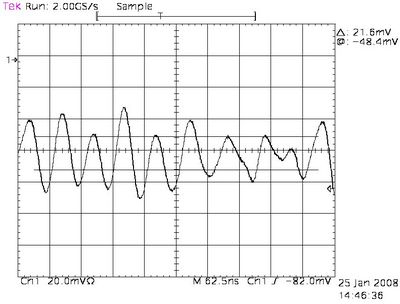
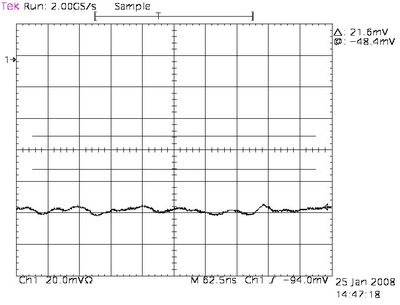
The improvement is vast! I also looked at the signals with this new setting, they are shown for each straw in figures 1.14-1.17.
They look pretty good, I think.
After this test point some straws were wrapped with Al-foil. The effect was that the shape of the noise stayed the same but the amplitude of the noise went down from 1.38 to 1.08 mV (average); straw 1 was used for this test.
2 Some studies concerning noise and shielding - without shaper
Setup:
- HV = 1800 V
- NO shaper
Three straws are observed. We'll call them straw 1,2, and 3 (those are the same straws as in previous section).
Test 1:
- Shielding over the upstream end plenum + preAmp: yes
- Extra shielding over the straws: no
- Shielding over the downstream end plenum: no
The oscilloscope traces of straw 1,2, and 3 are shown in figure 2.1, 2.2, and 2.3.
Test 2:
- Shielding over the upstream end plenum + preAmp: yes
- Extra shielding over the straws: no
- Shielding over the downstream end plenum: yes
The oscilloscope traces of straw 1,2, and 3 are shown in figure 2.4, 2.5, and 2.6.
Test 3:
- Shielding over the upstream end plenum + preAmp: yes
- Extra shielding over the straws: yes
- Shielding over the downstream end plenum: no
The oscilloscope traces of straw 1,2, and 3 are shown in figure 2.7, 2.8, and 2.9.
And why not? Test 4:
- Shielding over the upstream end plenum + preAmp: yes
- Extra shielding over the straws: yes
- Shielding over the downstream end plenum: yes
The oscilloscope traces of straw 1,2, and 3 are shown in figure 2.10, 2.11, and 2.12.
3 Signals with shaper
I just had a look at the signal after the shaper board. I took 3 different straws this time (again called straw 1,2, and 3). The scope traces of the noise are shown in figure 3.1, 3.2, and 3.3, and the ones of the signal are in figure 3.4, 3.5, and 3.6.
Notice the different vertical scale of straw 2, this is channel 3 on the shaper. Did Gerard changed the gain of this channel? No he did not. After reconnecting the cable this "effect" disappeared.
4 Pedestals
The pedestal width of:
- CDC + HVDB + CLAS preAmp + old postAmp = 29 channels
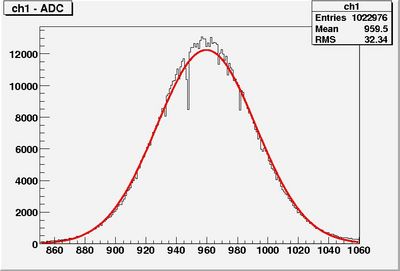
- CDC + HVDB + new preAmp + shaper = 29 channels (but the gain of this setup is much higher) (see figure 4.2)
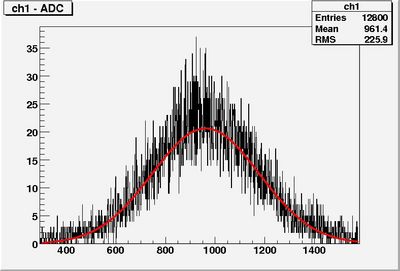
(before shielding = 200 channels, see figure 4.1)
- new preAmp + shaper = 5.5 channels
5 Noise studies: how to shield the upstream end plenum
Test were done with shielding the upstream end plenum in different ways.
Setup:
- CDC+HVDB+interposer+preAmp+shaper+scope
Reference
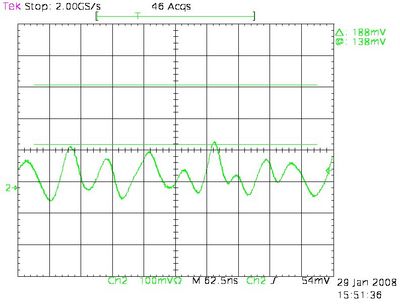
No shielding present, noise shown in figure 5.1 (please pay attention to the vertical scale when comparing).
Al foil with no connection to the preAmp
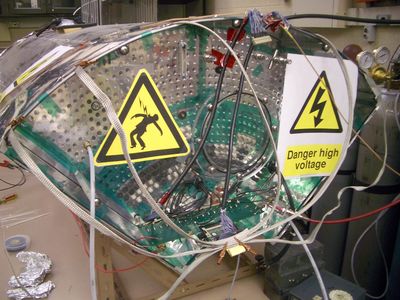
For the setup see picture 5.1, note that there is no contact between the preAmp and the shielding. The scope traces of the noise are shown in figure 5.2. There is not much difference with the reference.
Al foil with connection to the preAmp's cooling strip
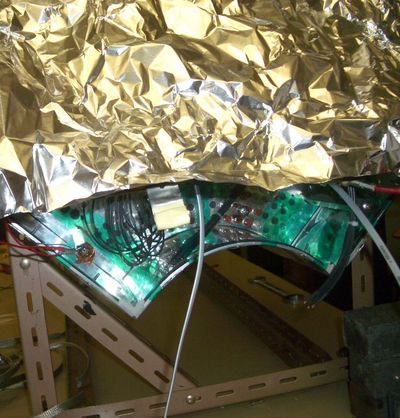
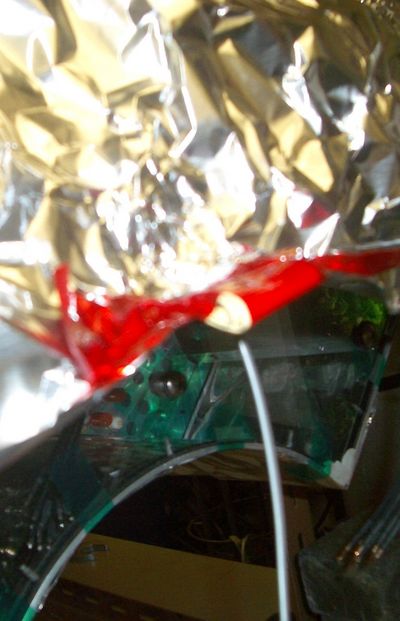
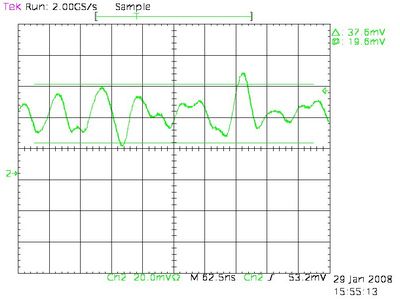
For the setup see picture 5.2, note that there is a electrical contact between the preAmp and the shielding. The scope traces of the noise are shown in figure 5.3. There is a huge difference with the reference, the amplitude of the noise is much smaller.
Braids in connection with the preAmps cooling strip
For the setup see picture 5.3, note that there is a electrical contact between the preAmp and the braids. The scope traces of the noise are shown in figure 5.4. Compared to previous setup the noise is a bit worse but compared to the reference it is still a vast improvement. One braid connection is not enough, one need a few to get the noise down.
6 New HVB design
A mail was sent to the gluex-electronics list with the design attached.
7 Some improvement on the drift time spectra
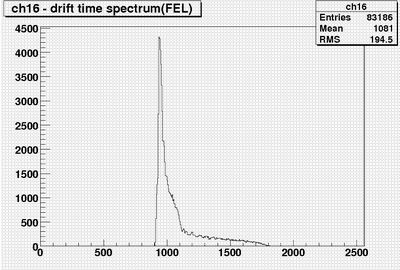
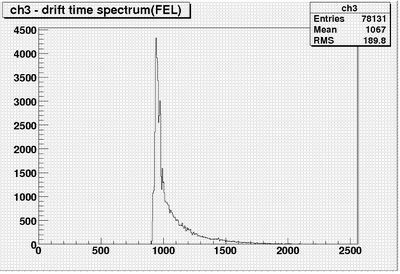
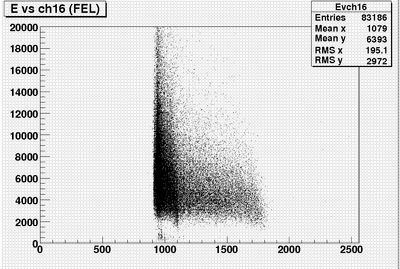
By tuning the code a little bit like playing with the threshold and fit the leading edge of the first peak and not the highest peak the drift time spectra of some channels improved while other ones stayed basically the same. In figure 7.1, 7.2 a good/bad drift time spectrum can be seen. In figure 7.3,7.4 a correlation plot of energy (= integrated signal in ADC channels) vs drift time can be seen for the good/bad spectrum respectively.
