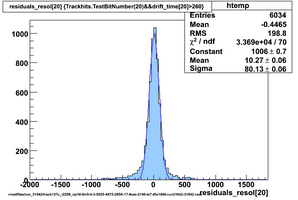
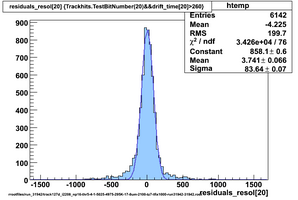
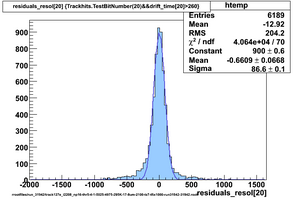
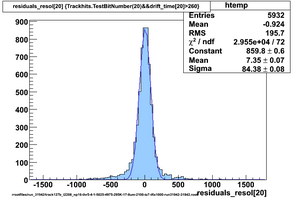
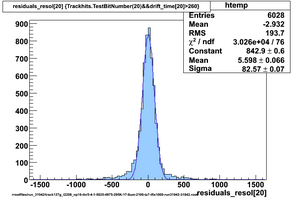
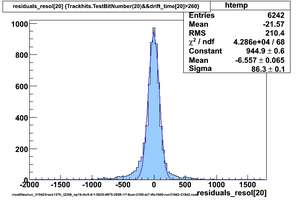
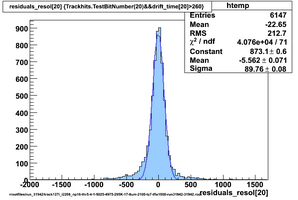
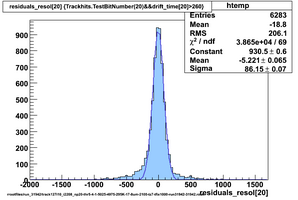
CDC algo tuning
Using prototype data from CDC_50_50 (run 31942) with offline analysis
50/50 Ar/CO2 and cosmics, 2100V, prototype horizontal
Contents
Original code, many samples upsampled
- Event pedestal is mean of 100 samples ending at trigger time
- Upsample 200 samples starting 50 before trigger time
- Find hit threshold crossing
- Step back <pedlead> points to find new local pedestal
- Search forward to find high threshold crossing
- Search backward to find low threshold crossing
- Project through both thresholds to find pedestal crossing time
Only 20 samples upsampled
- Event pedestal is mean of 100 samples ending at trigger time
- Find hit threshold crossing
- Upsample 20 samples starting 10 before hit threshold crossing
- Find hit threshold crossing again in upsampled data
- Step back <pedlead> points to find new local pedestal
- Search forward to find high threshold crossing
- Search backward to find low threshold crossing
- Project through both thresholds to find pedestal crossing time
Net difference between this and the previous code with 200 samples upsampled is the range of the upsampled data available to the high threshold search in step 5 and 6 respectively.
Trying out ideas for simplification
Ideas
- Check whether interpolating threshold xings makes any difference.
- Use the 3rd sample or 4th sample (or mean of 3rd & 4th samples) before hit threshold as local pedestal
- Try reverting to one threshold crossing instead of the extrapolation
- Try something easier for event pedestal - mean of 4 samples immediately before trigger
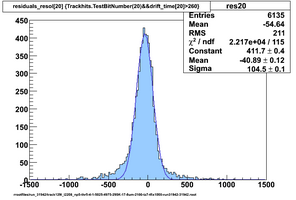
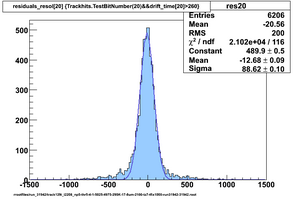
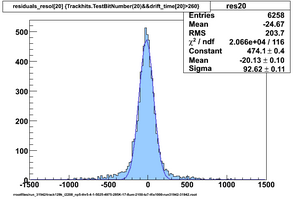
Pics below try these out one at a time (not cumulative)
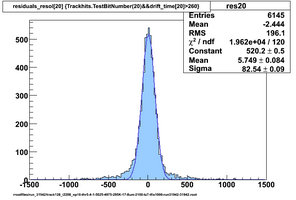
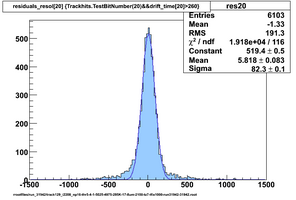
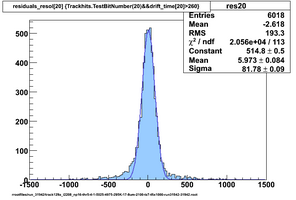
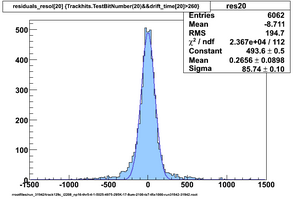
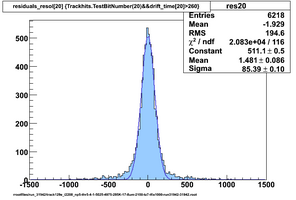
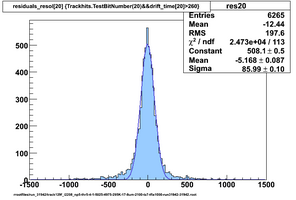
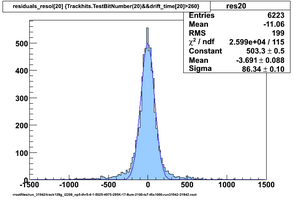
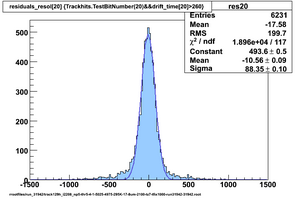
Image with blue and green borders are from single threshold crossings; images with green borders are without interpolation.
Data below from code with event ped = mean of 4 samples, local ped = mean of 4 and 5 samples before hit threshold, hit time is projection of high and low threshold crossings (interpolated) to the local pedestal
Original code, many samples upsampled. This section is a bit confusing. Replacement is above.
- Event pedestal is mean of 100 samples ending at trigger time
- Find hit threshold crossing
- Step back <pedlead> points to find new local pedestal
- Search forward to find high threshold crossing
- Search backward to find low threshold crossing
- Project through both thresholds to find pedestal crossing time
Trying out ideas for simplification
Ideas
- Check whether interpolating threshold xings makes any difference - no, not if extrapolating through thresholds to pedestal.
- Use the 3rd sample (or mean of 3rd & 4th samples) before hit threshold as local pedestal
- Try reverting to one threshold crossing instead of the extrapolation - only slight increase to res width
- Try something easier for event pedestal - mean of 4 samples immediately before trigger - this might be an improvement, probably because the pedestal is closer in time to the hits
- Event pedestal is mean of 4 samples ending at trigger time
Fewer samples upsampled
- Event pedestal is mean of 100 samples ending at trigger time
- Find hit threshold crossing
- Upsample region (20 samples) around threshold crossing, with threshold crossing sample in set position (10th sample)
- Search again for hit threshold in small region of upsampled data
- Step back <pedlead> points to find new pedestal
- Search forward to find high threshold crossing
- Search backward to find low threshold crossing
- Project through both thresholds to find pedestal crossing time
This is not exactly the same as the first case (when 100 samples are upsampled) because after the hit threshold is found using regular samples, the search through the upsampled data is restricted to a small region. If the upsampled values (every 5th point) are not exactly the same as the sampled data, the wider search could run on further.
- Event pedestal is mean of 4 samples ending at trigger time
- Find hit threshold crossing
- Upsample region (20 samples) around threshold crossing, with threshold crossing sample in set position (10th sample)
- Search again for hit threshold in small region of upsampled data
- Step back <pedlead> points to find new pedestal
- Search forward to find high threshold crossing
- Search backward to find low threshold crossing
- Project through both thresholds to find pedestal crossing time
Use low threshold instead of projection from high threshold through low threshold to pedestal
- Event pedestal is mean of 4 samples ending at trigger time
- Find hit threshold crossing
- Upsample region (20 samples) around threshold crossing, with threshold crossing sample in set position (10th sample)
- Search again for hit threshold in small region of upsampled data
- Take local pedestal as <pedlead> points before hit threshold crossing (upsampled)
- Search backward from hit threshold to find low threshold crossing, take this to be hit time (no extrapolation)
Do not search again for hit threshold in upsampled data, use original value
- Event pedestal is mean of 4 samples ending at trigger time
- Find hit threshold crossing
- Upsample region (20 samples) around threshold crossing, with threshold crossing sample in set position (10th sample)
- Take local pedestal as <pedlead> points before hit threshold crossing
- Search backward from hit threshold to find low threshold crossing, take this to be hit time (no extrapolation)
