CDC prototype flowrates

From GlueXWiki
Jump to: navigation, search

Use mixed 50/50 Ar/CO2 and vary the flow rate through the mixer.

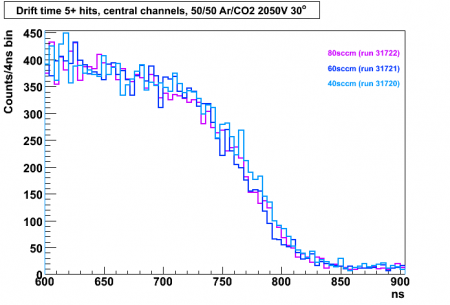
Data taken at 80sccm total, 60sccm and 40sccm (in that order). Drift time histograms are for the central block of straws (middle 2 in each row). All are at 2050V.


Upper end of drift time histo of tracks through central block of straws (middle 2 in each row)

Collected more data at 80sccm.

Drift time histo 2050V
Upper end of drift time histo of tracks through central block of straws (middle 2 in each row)
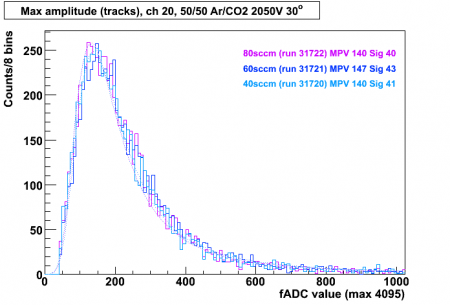
Max amplitude histo for ch20 (straw 17) 2050V

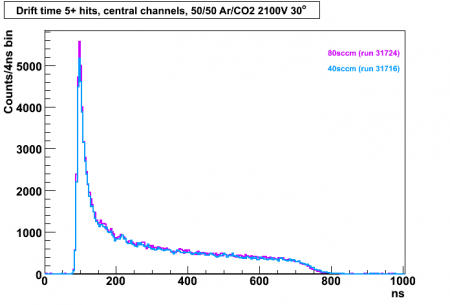
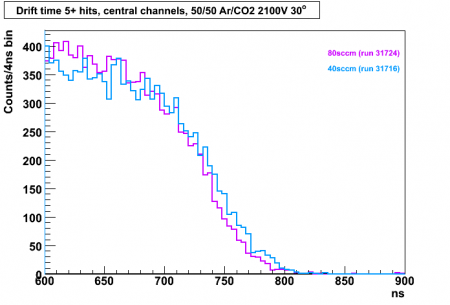
Collected more data at 2100V.

Drift time histo 2100V
Upper end of drift time histo of tracks through central block of straws (middle 2 in each row)
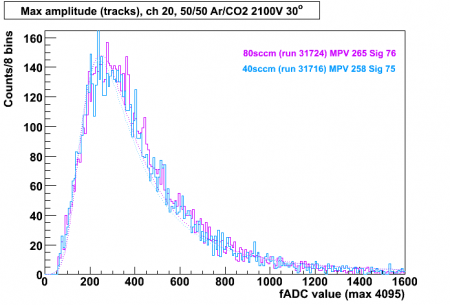
Max amplitude histo for ch20 (straw 17) 2100V

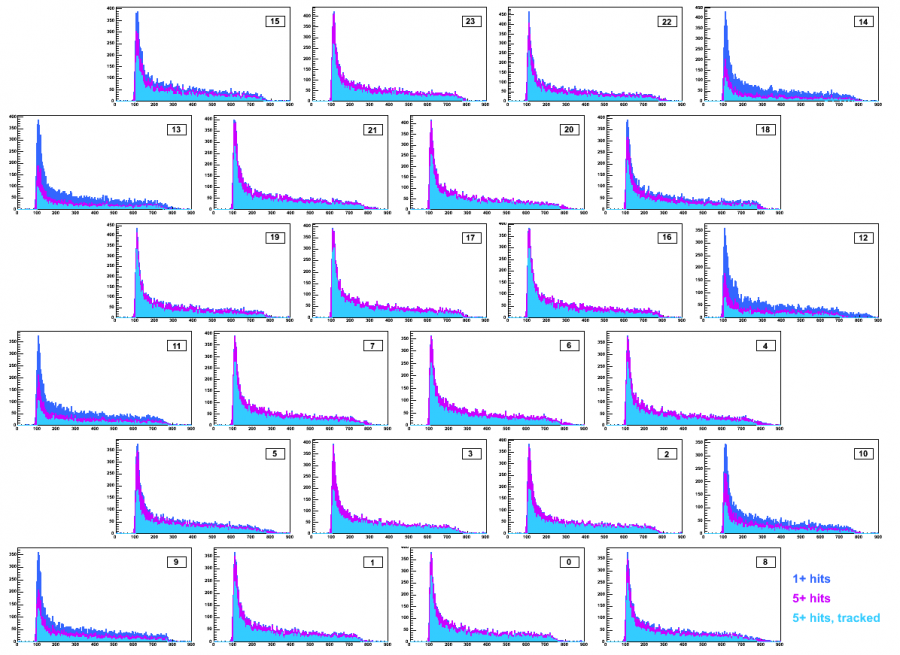
Drift time for 1 or more hit (dark blue), 5 or more hits (pink), and tracks with 5 or more hits (light blue) for 2050V 60sccm data
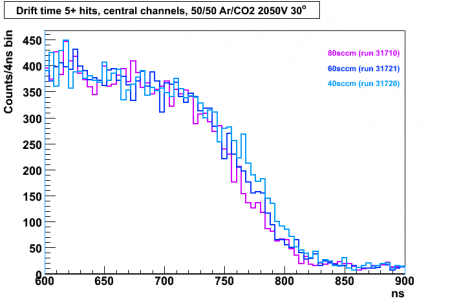
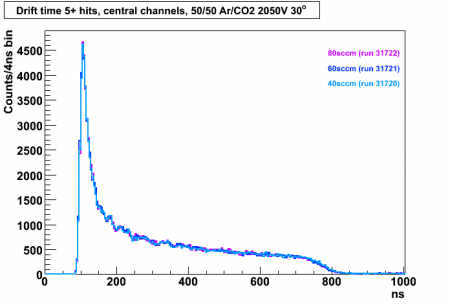
Drift time for run 31721 2050V 50/50 Ar/CO2 60sccm total flow rate