Latest approach to hit finding is as follows:
- Find a hit channel and filter events
- Calculate mean pedestal Pm & s.d. (σ) for first 100 samples in 100 events (trigger is approx sample 200)
- Set a threshold Pm + Tpm (Tpm ~ 3.5 σ) for further investigation, select events & channels where adc value exceeds this
- Calculate event pedestal
- Calculate event pedestal Pevt for current event & channel, as mean of 100 samples ending 10 samples before trigger time
- Use event pedestal to find high threshold time and new local pedestal
- Upsample data from samples 150 to 350 (max drift time + trigger time is approx sample 290)
- Select events where adc value goes over a high threshold Pevt + Tpe at point x (Tpe ~ 5sigma))
- Find a local pedestal Ploc as adc value at Np upsampled points (minisamples) before x (eg Np=15)
- Use local pedestal to find high and low threshold times
- Search forward from x-Np to find point x1 where data goes over a slightly less high threshold Ploc + Th where Th ~ 4 σ
- Search backward from x1 to find point x2 where data goes below low threshold Ploc + Tl where Tl ~ σ
To find where to take local pedestal:
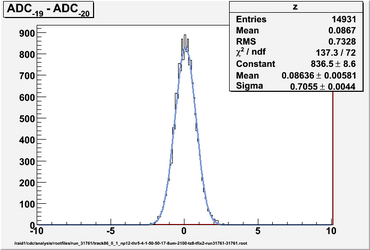
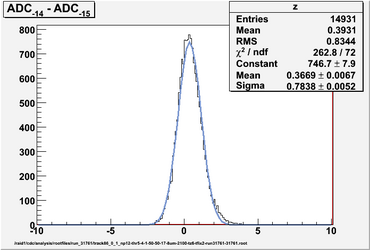
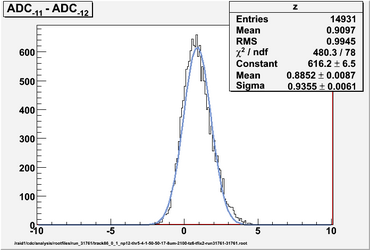
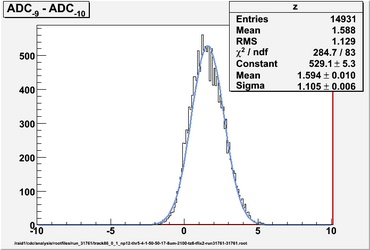
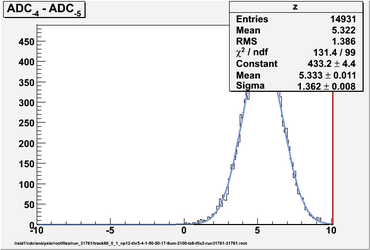
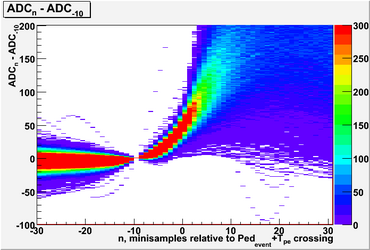
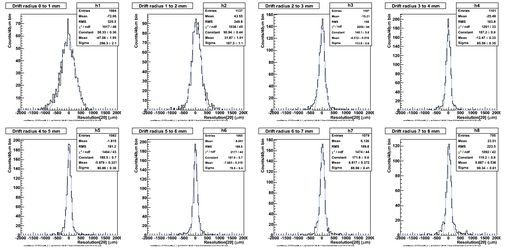
Distribution of ADC values after subtracting pedestal at different Np
 20 minisamples before threshold crossing |
 15 minisamples before threshold crossing |
 12 minisamples before threshold crossing |
 10 minisamples before threshold crossing |
 5 minisamples before threshold crossing |
ADC values after subtracting pedestal at different Np
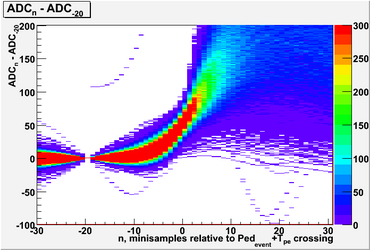 20 minisamples before threshold crossing |
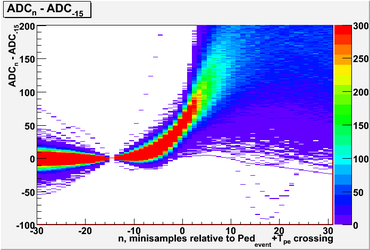 15 minisamples before threshold crossing |
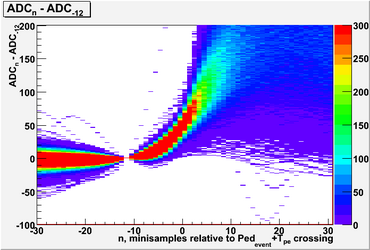 12 minisamples before threshold crossing |
 10 minisamples before threshold crossing |
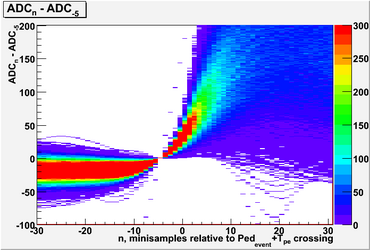 5 minisamples before threshold crossing |
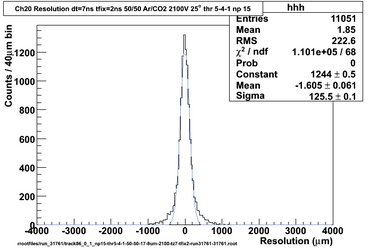
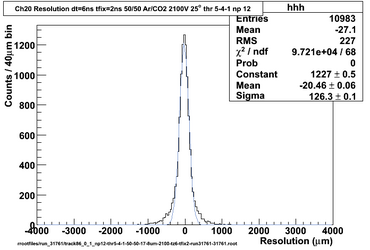
Resolution after subtracting pedestal at different Np for Th1 5sigma, Th = 4sigma, Tl = 1sigma
 20 minisamples before threshold crossing (tz=8) |
 15 minisamples before threshold crossing (tz=7) |
 12 minisamples before threshold crossing (tz=6) |
 10 minisamples before threshold crossing (tz=6) |
|
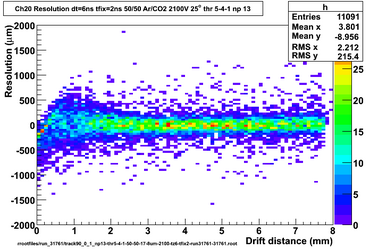
Optimised thresholds and Np - best combination for this data (2100V, 50/50 Ar/CO2, prototype tilted at 25o to horizontal) is Th1 5sigma, Th = 4sigma, Tl = 1sigma and Np = 13 or 14 with dt=6ns.
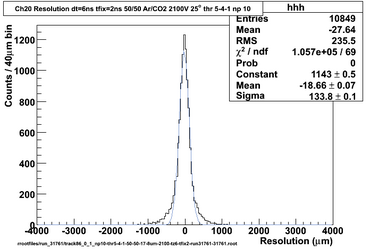
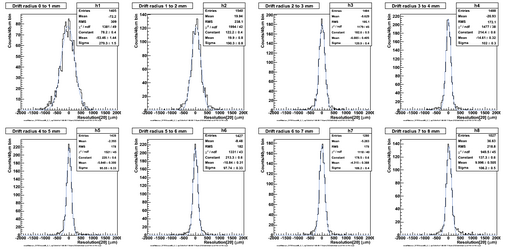
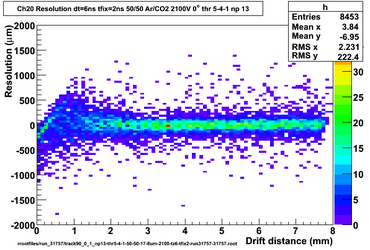
Drift-time=Tl crossing time; Th1 5sigma, Th = 4sigma, Tl = 1sigma, Np=14, dt=6
|
|
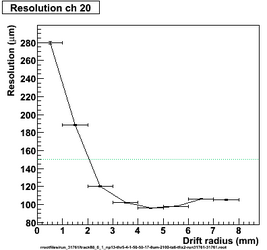
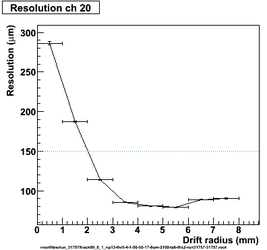
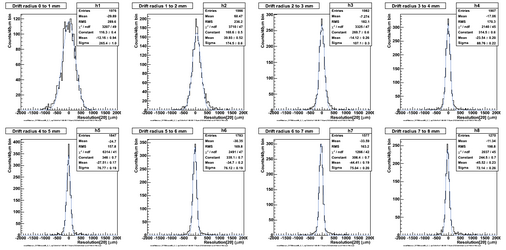
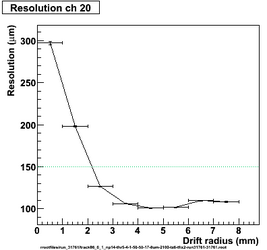 Resolution with drift distance ch20 |
 Resolution with drift distance ch20 |
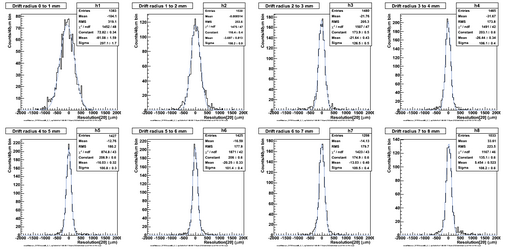 Resolution with drift distance ch20 |
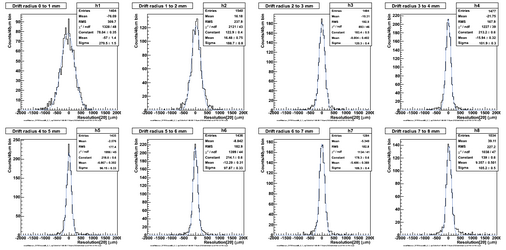
Drift-time=Projection from Th through Tl to Ploc; Th1 5sigma, Th = 4sigma, Tl = 1sigma, Np=13, dt=6
|
|
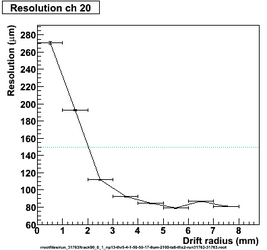
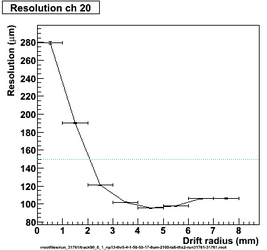 Resolution with drift distance ch20 |
 Resolution with drift distance ch20 |
 Resolution with drift distance ch20 |
Drift-time=Intercept of straight line fit of crossing-points of Th Tl and their midpoint with Ploc; Th1 5sigma, Th = 4sigma, Tl = 1sigma, Np=13, dt=6
|
|
 Resolution with drift distance ch20 |
 Resolution with drift distance ch20 |
 Resolution with drift distance ch20 |
RMS is least for Drift-time=Projection from Th through Tl to Ploc. Use this to look at data taken with prototype at different angles. All data above were with prototype at 25o to horizontal
Prototype horizontal Drift-time=Projection from Th through Tl to Ploc; Th1 5sigma, Th = 4sigma, Tl = 1sigma, Np=13, dt=6
|
|
 Resolution with drift distance ch20 |
 Resolution with drift distance ch20 |
 Resolution with drift distance ch20 |
Prototype 25o to horizontal Drift-time=Projection from Th through Tl to Ploc; Th1 5sigma, Th = 4sigma, Tl = 1sigma, Np=13, dt=6
|
|
Resolution with drift distance ch20 |
Resolution with drift distance ch20 |
Resolution with drift distance ch20 |
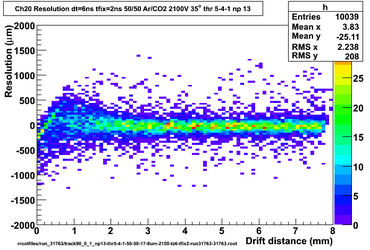
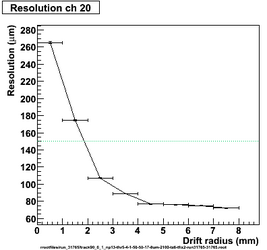
Prototype 35o to horizontal Drift-time=Projection from Th through Tl to Ploc; Th1 5sigma, Th = 4sigma, Tl = 1sigma, Np=13, dt=6
|
|
 Resolution with drift distance ch20 |
 Resolution with drift distance ch20 |
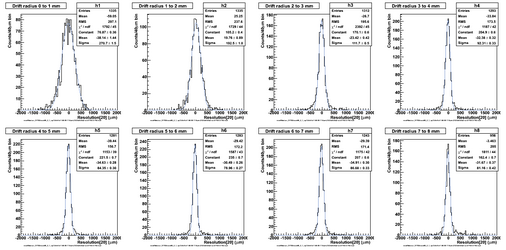 Resolution with drift distance ch20 |
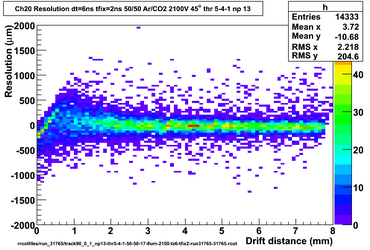
Prototype 45o to horizontal Drift-time=Projection from Th through Tl to Ploc; Th1 5sigma, Th = 4sigma, Tl = 1sigma, Np=13, dt=6
|
|
 Resolution with drift distance ch20 |
 Resolution with drift distance ch20 |
 Resolution with drift distance ch20 |
Leading edge gradient from Th to Tl with Ploc; Th1 5sigma, Th = 4sigma, Tl = 1sigma, Np=13, dt=6
|
|
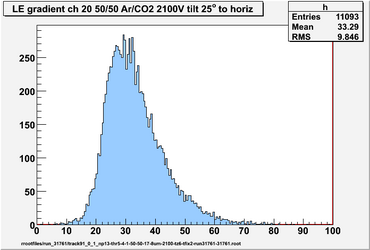 Prototype 25 o to horizontal |
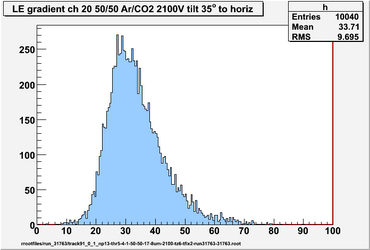 Prototype 35 o to horizontal |
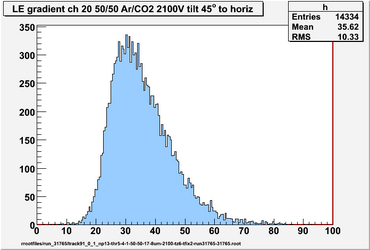 Prototype 45 o to horizontal |
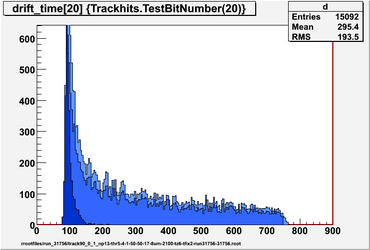
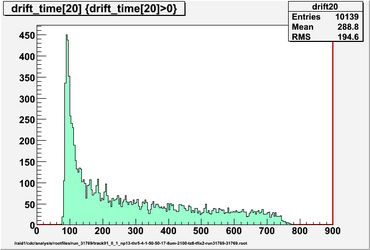
Drift times for untracked, tracked and first hits in ch20 (first hit = earliest hit of all hits for that event)
Plotted on the suspicion that the peaks in the drift time
histogram are caused by after-event ringing in the prototype.
 track91 prototype horizontal, same settings as previous set |
|
Drift time with top scint disc signal expanded to cover whole of lower scint signal (not just its leading edge)
track91 horizontal same settings as previous
|
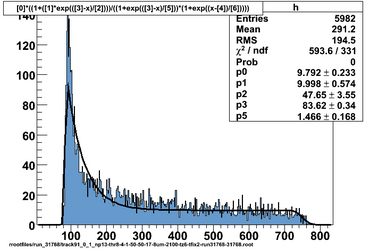
Fit to drift time histogram, untracked hits in ch20 vs drift time (ns)
|
Function from G.Avolio et al NIM A523 (2004) 309-322
TF1 *f = new TF1("f","[0] + [1]*(1+[2]*exp(([4]-x)/[3]) ) / ( (1+exp(([4]-x)/[6])) * (1+exp((x-[5])/[7])) )")
Parameter 0 is constant background; 4 is t0, 6 is the slope of the leading edge at t0; 5 is tmax and 7 is the slope of the tail at tmax; 2,3 and 4 describe the fall-off after the peak.
I didn't use param [0] as there is so little noise. To get a reasonable looking fit, tmax was fixed at 750 and the tmax tail slope was fixed at 10.
Added another term to the function to model the fall-off better.
TF1 *g2 = new TF1("g2","[0] * (1 + [1]*exp(([3]-x)/[2]) + [7]*exp(([3]-x)/[8]) ) / ( (1+exp(([3]-x)/[5])) * (1+exp((x-[4])/[6])) )")
Drift time fit improved
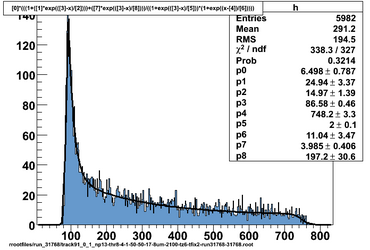 Fit to drift time histogram |
|
The fit gives a t0 estimate of 86.6.
The value which gives best resolution (and least dependence of resolution on drift time) is 86ns (80.0 from straight line fit to leading edge + 6ns to optimize the resolution), with early arrivals moved to t0+2ns. The extra 6ns were determined by trial and error after starting from a rough estimate of the time at 2/3 of the way up the leading edge (84ns).


