Cosmics, 50/50 gas, 2100V (left column(s)) 2090 (right column(s))
Copied new data onto this page CDC_signal_integration_new
- Caveat: LHS data were with preamp underpowered, 2.65V on preamp card; RHS data were with 3.0V @ preamp card****
Run numbers are 31757 (horiz) and 31765 (tilt 45deg) at 2.65V, 2.1kV; 31809 (horiz) and 31810 (45 deg) at 3.0V, 2.09kV
Pedestal height
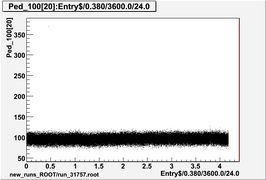 No tilt, LV 2.7V, HV 2100V |
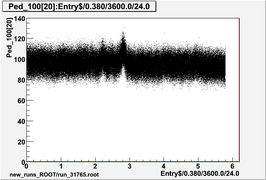 45 degrees, LV 2.7V, HV 2100V |
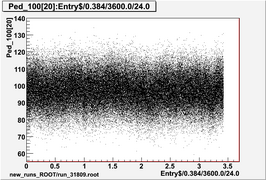 No tilt, LV 3.0V, HV 2090V |
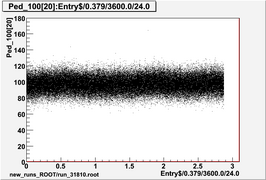 45 degrees, LV 3.0V, HV 2090V |
Pedestal width (std dev of first 100 samples in each event)
 No tilt, LV 2.7V, HV 2100V |
 45 degrees, LV 2.7V, HV 2100V |
 No tilt, LV 3.0V, HV 2090V |
 45 degrees, LV 3.0V, HV 2090V |
Histograms of first max in signal amplitude with hit threshold 4 x pedestal sigma
 No tilt, LV 2.7V, HV 2100V |
 45 degrees, LV 2.7V, HV 2100V |
 No tilt, LV 3.0V, HV 2090V |
 45 degrees, LV 3.0V, HV 2090V |
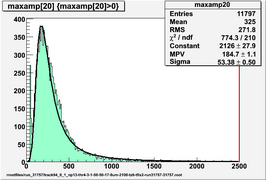
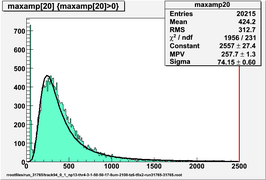
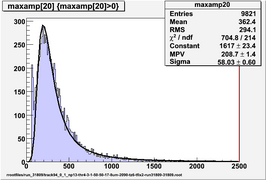
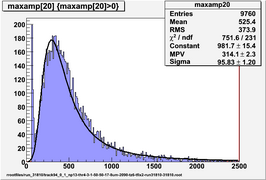
Histograms of first max in signal amplitude with hit threshold 5 x pedestal sigma
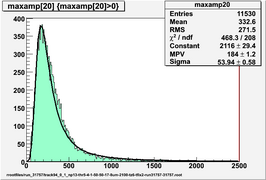 No tilt, LV 2.7V, HV 2100V |
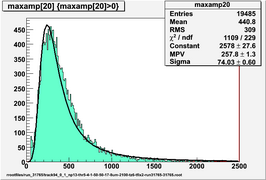 45 degrees, LV 2.7V, HV 2100V |
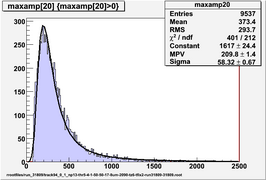 No tilt, LV 3.0V, HV 2090V |
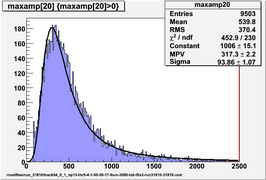 45 degrees, LV 3.0V, HV 2090V |
Data below are for hit threshold 5 x pedestal sigma
Try to calculate dE/dx...
Track length is calculated in the plane parallel to the endplates (no z information) so I scaled it by the tilt of the prototype for the 45 degree data, the upper cosmic trigger scintillator is high up enough that the cosmics are ~ vertical.
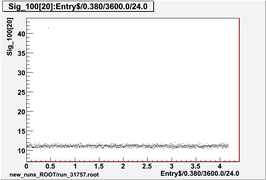
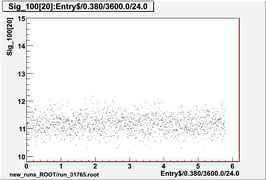
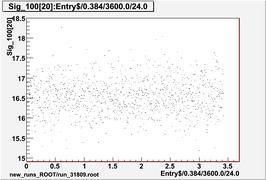
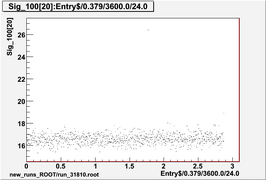
integration from low threshold crossing for next 700ns / track length
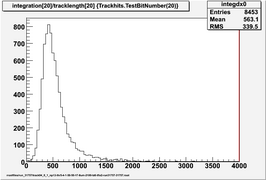 No tilt, LV 2.7V, HV 2100V |
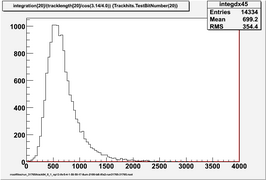 Tilted at 45 degrees, LV 2.7V, HV 2100V |
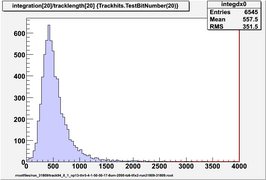 No tilt, LV 3.0V, HV 2090V |
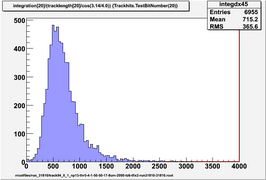 Tilted at 45 degrees, LV 3.0V, HV 2090V |
The ratio of tilted to horizontal integration means is 1.24 (old data) and 1.28 (new data); it should be 1 (as they are already scaled by track length) so this means the tilted integrations are 25-30% too large.
height of first maximum in signal amplitude / track length
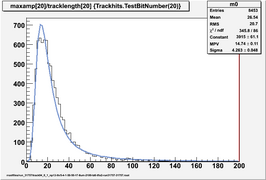 No tilt, LV 2.7V, HV 2100V |
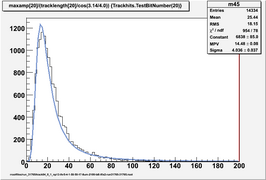 Tilted at 45 degrees, LV 2.7V, HV 2100V |
 No tilt, LV 3.0V, HV 2090V |
 Tilted at 45 degrees, LV 3.0V, HV 2090V |
The ratio of tilted to horizontal MPV of Landau fitted to amplitude/track length histogram is 0.99 (old data) and 1.07 (new data).
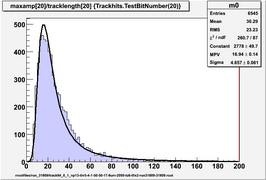
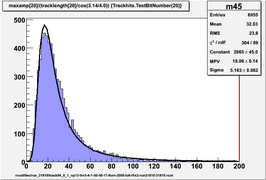
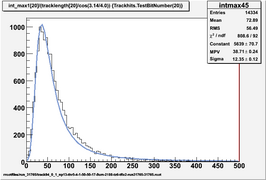
signal integrated from low threshold crossing to position of first maximum in signal amplitude / track length
 No tilt, LV 2.7V, HV 2100V |
 Tilted at 45 degrees, LV 2.7V, HV 2100V |
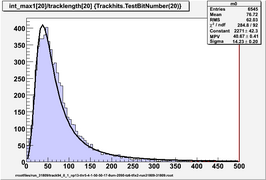 No tilt, LV 3.0V, HV 2090V |
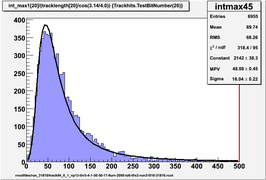 Tilted at 45 degrees, LV 3.0V, HV 2090V |
The ratio of tilted to horizontal MPV of Landau fitted to (integration to first maximum/tracklength) histogram is 1.07 (old data) and 1.18 (new data).
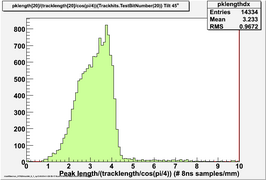
Look at time over threshold...
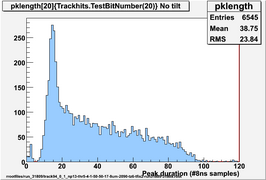
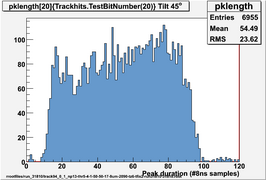
Peak duration is # samples after the lower threshold crossing until the ADC value decreases by 2sigma over 2 samples, this is a measure of time over threshold in units of 8ns
Peak duration
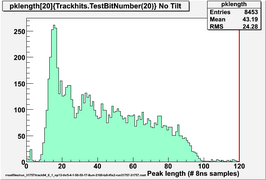 No tilt, LV 2.7V, HV 2100V |
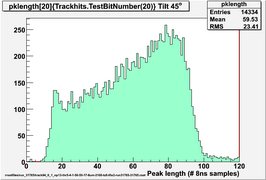 Tilted at 45 degrees, LV 2.7V, HV 2100V |
 No tilt, LV 3.0V, HV 2090V |
 Tilted at 45 degrees, LV 3.0V, HV 2090V |
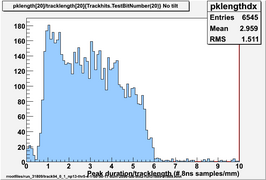
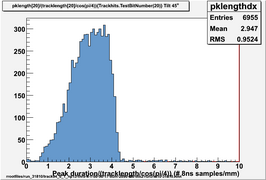
Peak duration / track length
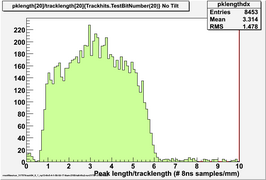 No tilt, LV 2.7V, HV 2100V |
 Tilted at 45 degrees, LV 2.7V, HV 2100V |
 No tilt, LV 3.0V, HV 2090V |
 Tilted at 45 degrees, LV 3.0V, HV 2090V |
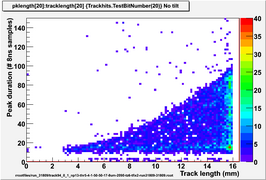
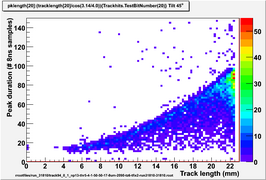
Peak duration vs track length
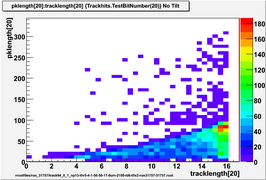 No tilt, LV 2.7V, HV 2100V |
 Tilted at 45 degrees, LV 2.7V, HV 2100V |
 No tilt, LV 3.0V, HV 2090V |
 Tilted at 45 degrees, LV 3.0V, HV 2090V |
Amplitude (first max) vs track length
|
|
|
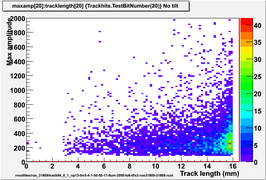 No tilt, LV 3.0V, HV 2090V |
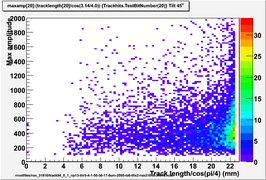 Tilted at 45 degrees, LV 3.0V, HV 2090V |
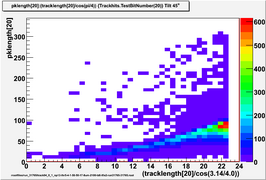
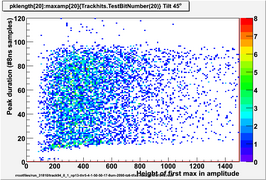
Peak length vs first maximum in signal amplitude
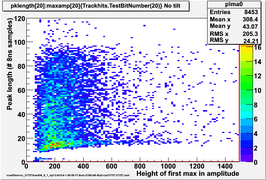 No tilt, LV 2.7V, HV 2100V |
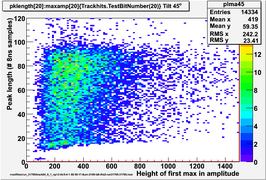 Tilted at 45 degrees, LV 2.7V, HV 2100V |
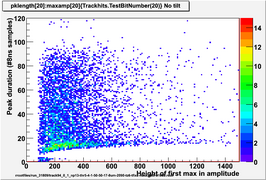 No tilt, LV 3.0V, HV 2090V |
 Tilted at 45 degrees, LV 3.0V, HV 2090V |


