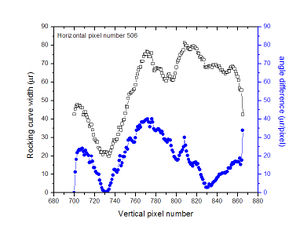
How the crystal curvature affects the rocking curve width
From GlueXWiki
In regions of a crystal where the local curvature is large along the direction perpendicular to the rocking axis, a significant part of the rocking curve peak width for a pixel can arise from variation of the peak position within the pixel. The following plots show significant correlation between the observed rocking curve widths and the local curvature for a selected row and a selected column of pixels.

