Hydra Monitoring
Hydra is an A.I. based system deployed in hall-D for near-real time data quality monitoring. It is, at regular intervals, fed images by Rootspy which are analyzed by a set of neural networks to provide basic classifications of the images to aid in monitoring.
Currently the system looks at 7 distinct occupancy plots: the BCAL, CDC, TOF, DIRC (south bar box), SC, FDC, FCAL. To add a new plot please contact tbritton@jlab.org.
Results are available in two different forms, both accessible from off site.
Hydra Runtime for real time inferences
and
Hydra Monitoring Log for trailing 24 hour view of potential problems
How to use Hydra Runtime:
1) go to the above link (you can leave it up and running as it auto updates)
2) glance over at the occupancy plots from time to time (look for plots that are outlined in red)
3) if a box is red look at the plot and compare it to the reference plot. If there is a problem look to the typical diagnostic programs (Rootspy, strip charts, etc) for the appropriate detectors and take appropriate action as necessary. The confidence given can be taken in to account (e.g Bad @ 0.6 likely deserves a little time if the image itself looks fine)
Note: The AI assume standard production, so special tests and runs can cause detector systems to appear bad to the A.I.
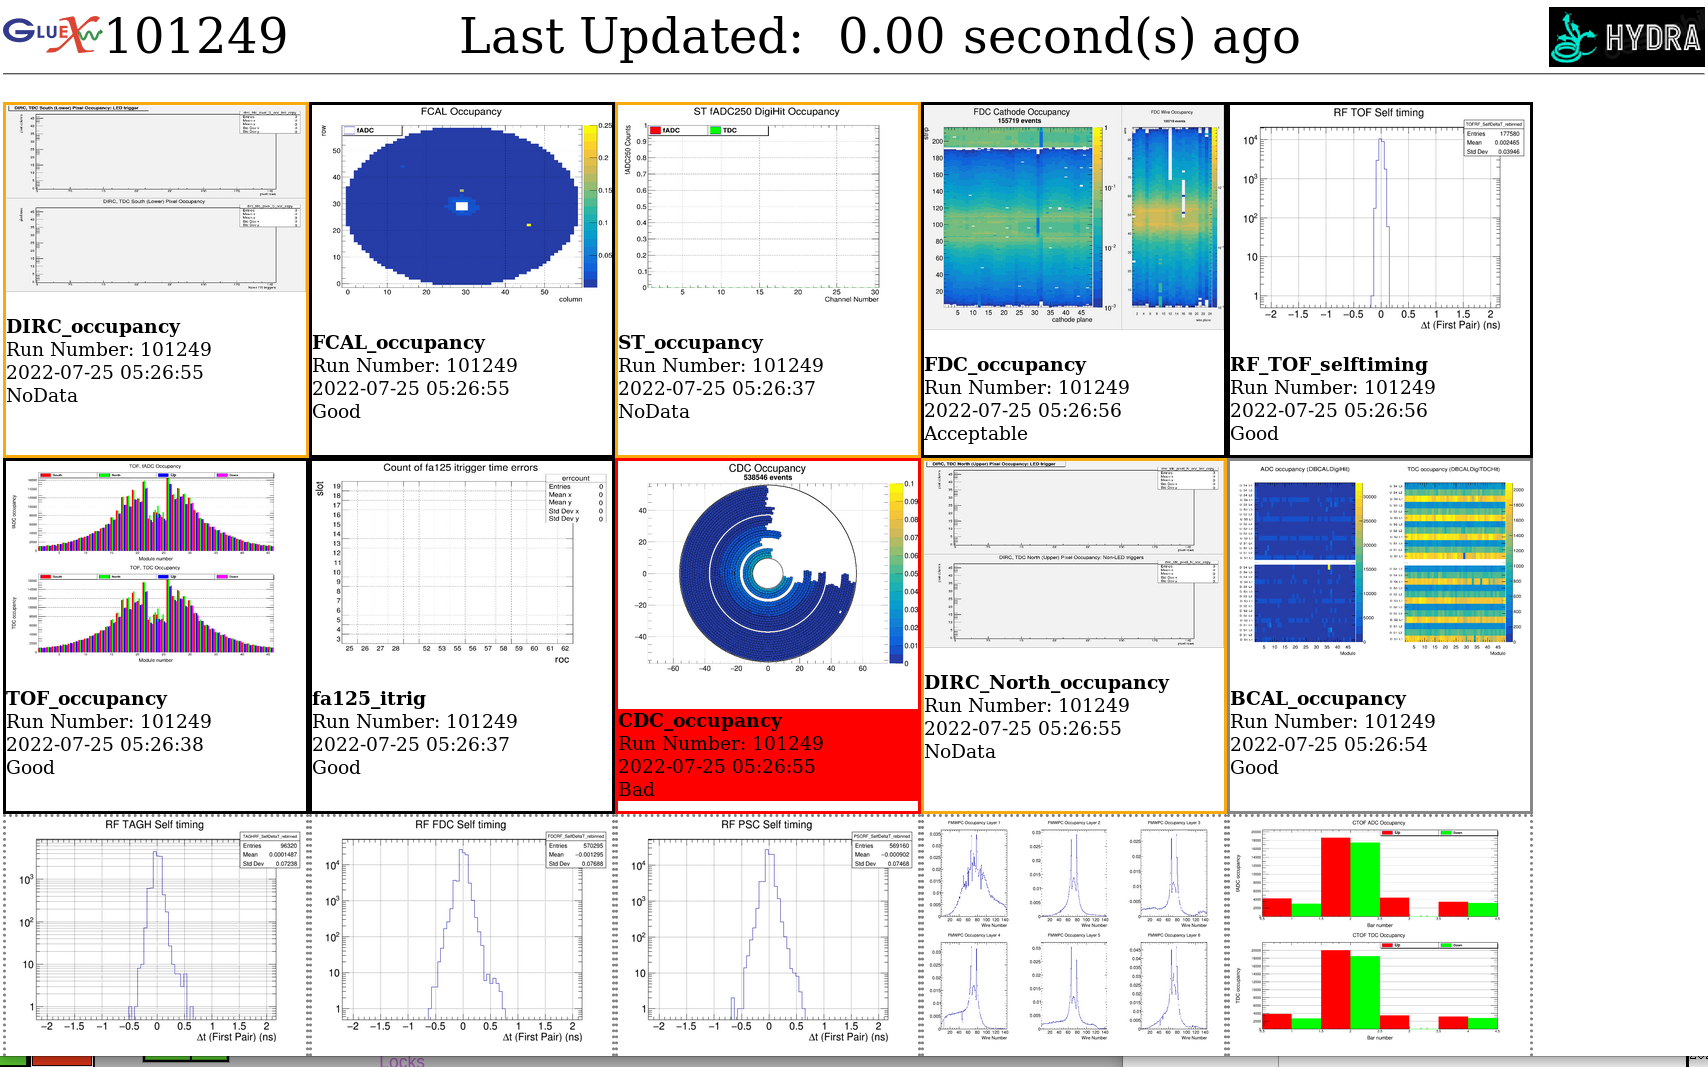
The first can be found at the Hydra Runtime page. Initially, and when monitoring is not running or data is not being taken, the page loads as a header block containing "Waiting for data..." or the run number and the last updated time. Below that are a set of empty rectangle blocks which will host the plots. This state should last at most a minute or so during active data taking. The Last updated time will increment as it waits for data, so rest assured the page is not broken. As data is received you will see the following 
Features:
double clicking on the experiment logo in the upper left of the window will toggle the showing of the model confidences
double clicking on the hydra logo in the upper right will show all frames hydra knows about
left clicking on an image will open the image in a new tab
double clicking in a frame will hide the frame (Useful for when a detector is not being used)
Each frame contains a border whose color indicates the category of the plots. All of the colors currently in use are shown in the above screenshot.
Black - nominal conditions (e.g. Good, Acceptable, LED, cosmic, etc) OR bad labeled plots which have no beam (no need to get paranoid if there is an apparent hole in a time slice when there is no beam)
Orange - the NoData condition (this could indicate an issue in monitoring e.g. rootspy producing blank images or a major issue with the detector at large, which should be accompanied by an alarm)
Gray - When the model's confidence in categorization is below a configurable threshold the border will turn Gray. This applies to every label
Red - Reserved for when the model is confident enough in assigning the "Bad" label. The red border appears alongside a red background behind the text of the frame. This should provide good visibility of the condition and indicates the need to carefully monitor the situation, possibly taking proper corrective action or invoking an expert. In the screenshot above a quarter of the CDC's electronics are known to be in use for CPP, thus it is safe to ignore this "Bad" state. If not it would be important to notify the expert(s) and document the outage.
Dashed - A Dashed border simply indicates a plot that hydra knows about but has no model in active production with which to perform analysis. It is simply provided to better enable individuals to monitor these plots in one location. Is your plot dashed? Head over to the labeler and get to labeling....and contact tbritton@jlab.org to get a model into production!
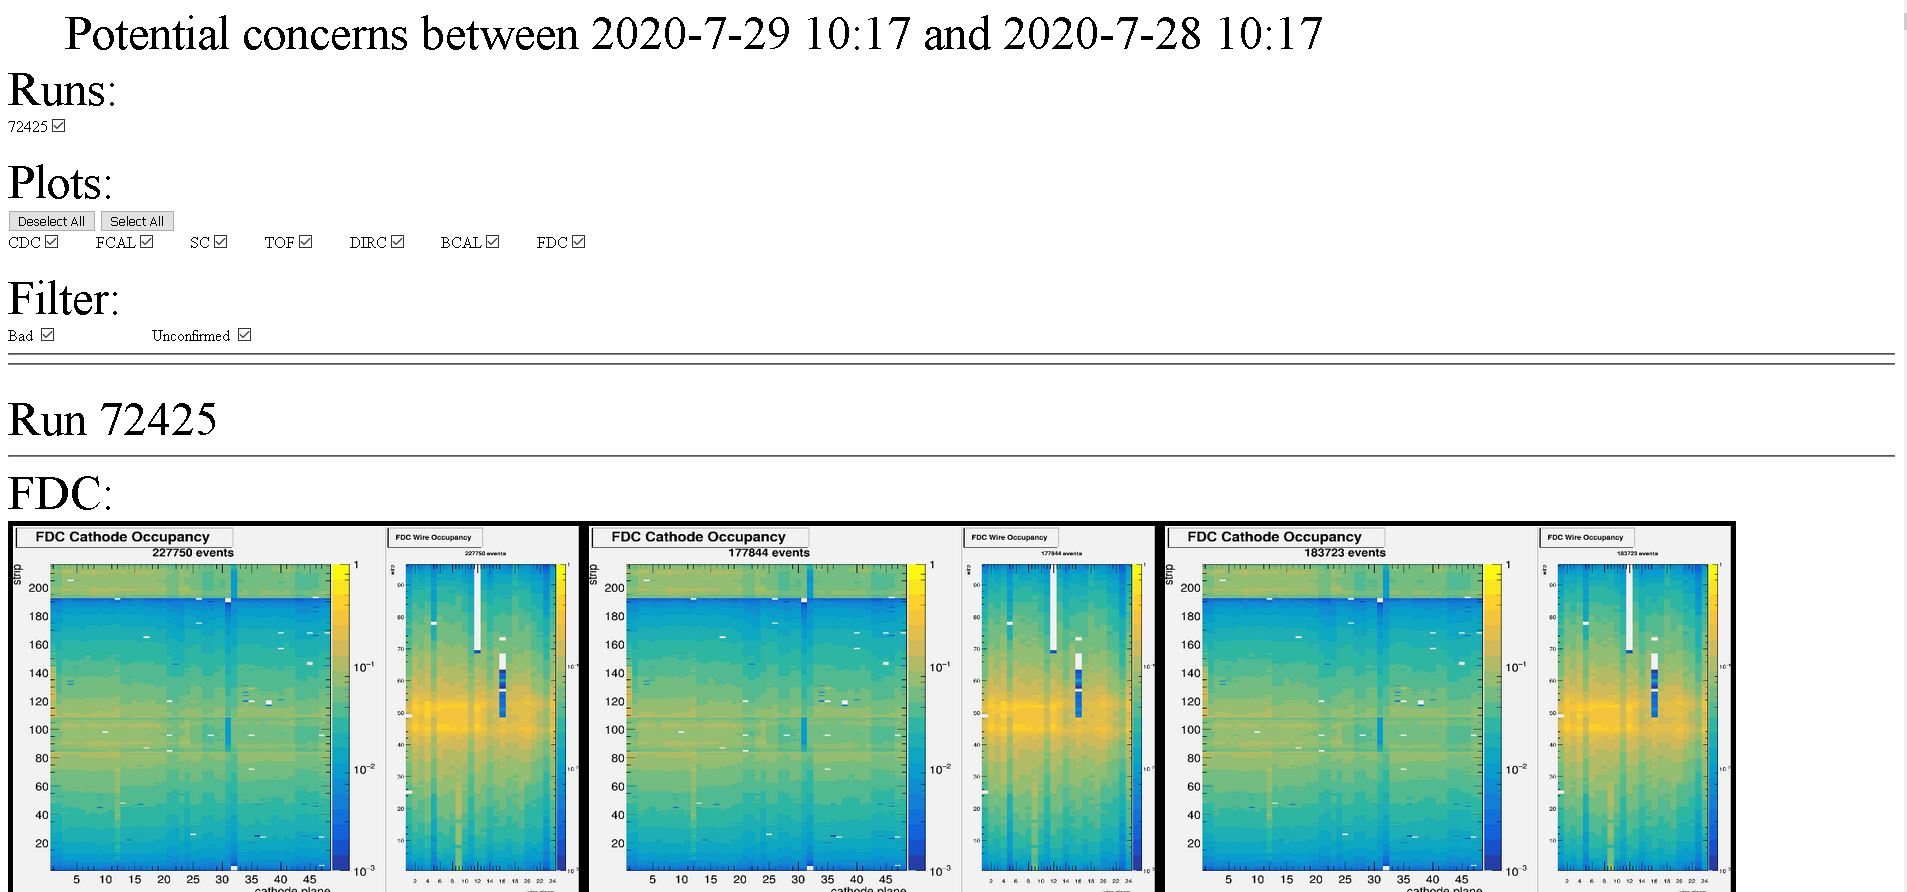
The second page can be found at the Hydra Monitoring Log page. This page shows only the plots deemed bad or needing a second opinion in the trailing 24 hours from the time the page is loaded. When there are images it will look like: 
This page's header contains many check boxes as well as a select all and deselect all button. Each check box essentially filters the plots further. Individual run numbers can be shown or hidden and even individual plots. For convenience, the "select all" button will check every plot box and the "Deselect all" will uncheck all plot boxes. Because this page only shows plots labeled as "Bad" and plots which fall below the configurable confidence level the "Filter" section only contains the ability to show the bad plots only or those plots that fall below the confidence threshold. Unchecking both boxes will lead to no images being displayed. In fact, the unchecking of all boxes in a single row will result in no plots being displayed as all plots belong to a single run number, are of a given type, and are either "Bad" or unconfirmed.