LE algo
- Work in progress - intended more as a logbook than presentation of results*
Results using Gerard's leading edge algo to extract drift-time from CDC prototype cosmics data
- 50/50 mixed Ar, CO2
- Recalibrated MFCs
- Outer plenum added to CDC prototype to prevent leaks
- New modified HVB
- 2050V
- Modified preamp4 (terminating resistors removed)
- Prototype tilted at 45o to enclosing scintillators (scints trigger the daq)
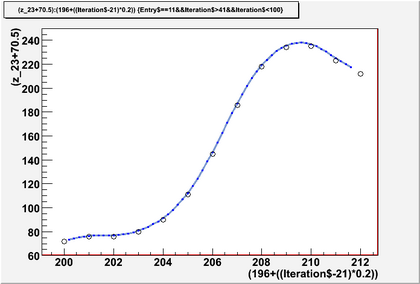
The original algorithm is here | LE algo It takes a number of samples from the ADC data, interpolates 4 extra points between each sample, convolutes them with the filter to give an approximation to the original pre-sampled data, and returns the first value above a predefined threshold. There are a variety of implementations below. The "without interpolation" results are from a simple comparison between ADC data and threshold.
Below: excerpt from one event in one straw showing interpolated and sampled fADC data
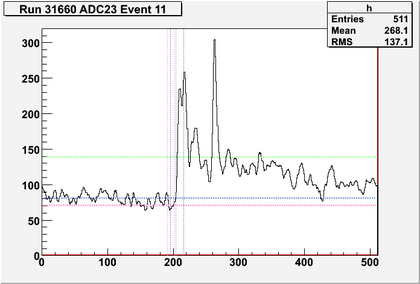
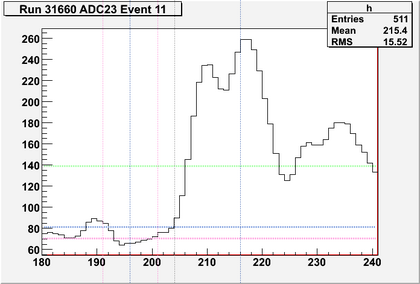
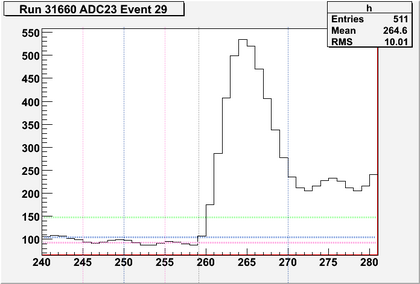
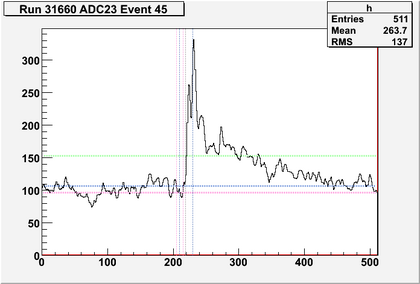
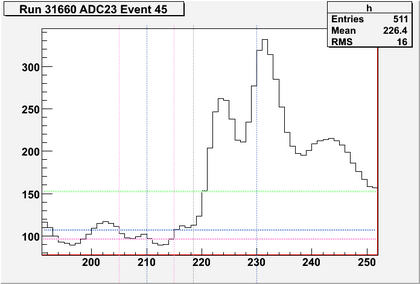
Below: Events with ADC data going above pedestal mean + 5 pedestal sigma are selected. 20 samples starting 10 samples before the threshold crossing are sent to the LE algo after subtracting mean pedestal. Pedestal mean is for 10 samples starting 15 samples before the threshold crossing. The threshold for the LE algo is 2 pedestal sigma. Pedestal sigma is for 100 early samples in 100 events. Left: all samples Right: zoomed
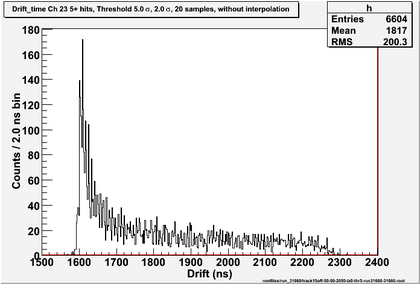
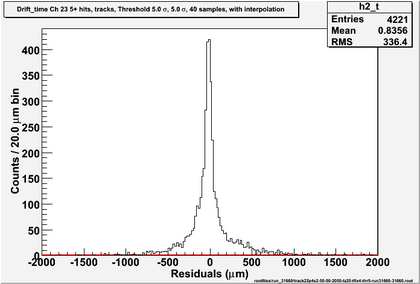
Left: drift-time with interpolation; Right: no interpolation
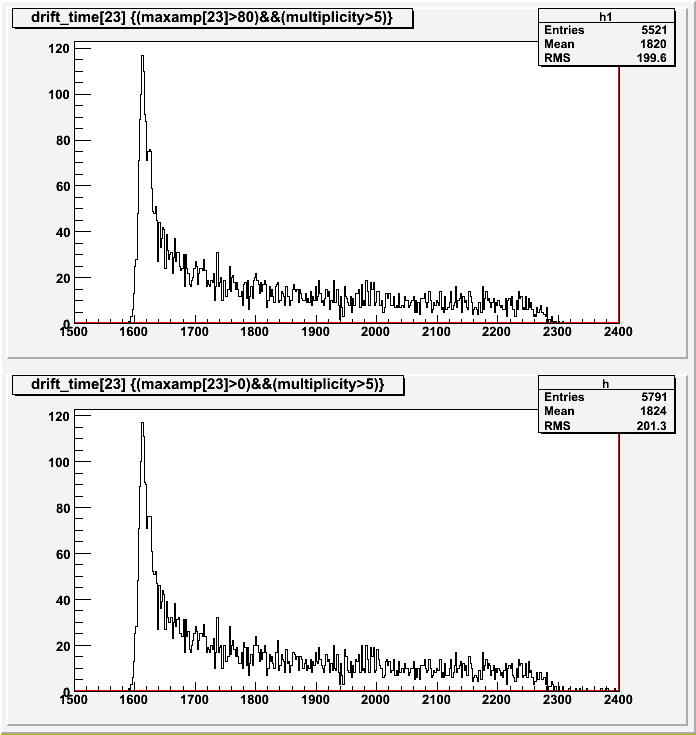
Below: Only events where a track can be fitted are selected. Tzero was obtained by fitting a straight line to the leading edge of the drift time histo (between the overall maximum and the minimum preceding it) and taking the value where it crosses the x-axis (this needs work). First the drift-time histo was put into 4ns bins to unify any double-maxima in the histogram.
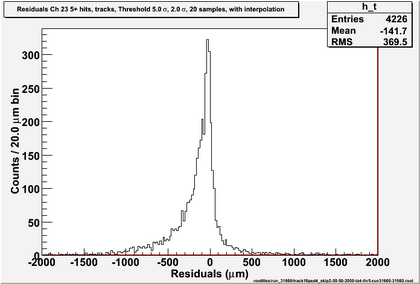
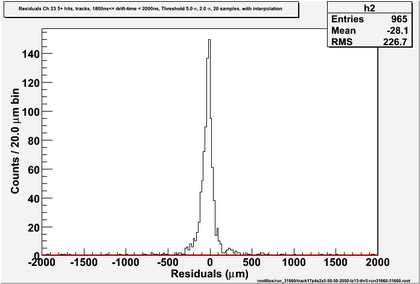
Negative residuals come from a tzero that is too small (or drift time that is too large). 2 sigma is ~ 20 in ADC value, a little late. Lowering the LE threshold makes it more likely to accept noise before the signal and so the # tracked events decreases slightly. However the LE search window can be tightened and a constant can be added to tzero.
Pedestal window is still bins 15 to 5 before the high-threshold crossing. LE sample data starts 10 bins before the high-threshold crossing.
Start the LE search an interval after the start of the LE sample data.
start+0bins: 3952 tracked hits
+5 bins: 4063 tracked hits
+6 bins: 4071 tracked hits
+7 bins: 3688 tracked hits
Move pedestal window up to end with the 4th bin before the high-threshold crossing, 10, 5 and 1 bin(s) wide (ie pedestal calculated as mean of 10, 5 and 1 bin).
Start the LE search an interval after the start of the LE sample data.
+0 bins = threshold xing - 5.8 bins: tracked hits: 3983 (10 bins) 4102 (5 bins) 4167 (1 bin)
+2 bins (threshold - 3.8): tracked hits: 3982 (10 bins) 4102 (5 bins) 4167 (1 bin)
+3 bins (threshold - 2.8): tracked hits: 3986 (10 bins) 4098 (5 bins) 4167 (1 bin)
+4 bins (threshold - 1.8): tracked hits: 3980 (10 bins) 4055 (5 bins) 4169 (1 bin)
+5 bins (threshold - 0.8): tracked hits: 4059 (10 bins) 4099 (5 bins) 4136 (1 bin)
+6 bins (threshold + 0.2): tracked hits: 3984 (10 bins) 3927 (5 bins) 3985 (1 bin)
Move pedestal bin to 3rd bin before the high-threshold crossing, 1 bin(s) wide Start the LE search an interval after the start of the LE sample data.
+2 bins (threshold - 3.8): tracked hits: 4120
+3 bins (threshold - 2.8): tracked hits: 4120
Below: pedestal at threshold-4 samples, with interpolation
Tzero is not defined particularly well - obtained as the zero-crossing-point of a fit of leading edge of drift time histo for 5+ hits after binning into 4ns to make sure that there is only one maximum (at present the code fits between the overall max and its preceding minimum). -ve residuals mean that drift time is too long. Try adding a constant to t-zero.
Below: after adding to t-zero. Events with drift time < tzero are assigned to tzero.
Number of tracks have dropped. Try assigning -ve drift time to something small but +ve.
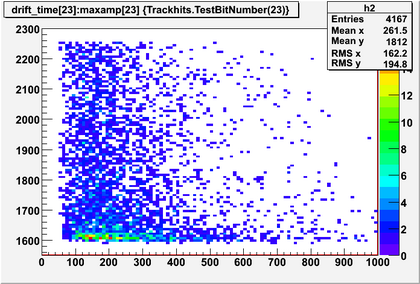
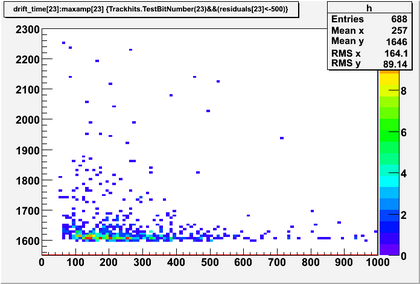
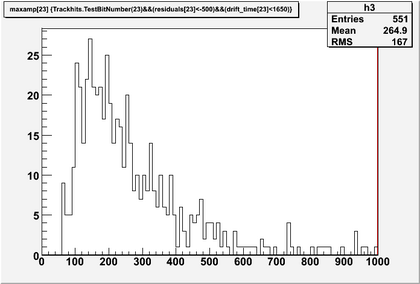
With nothing added to tzero, pick out events with large -ve residual and look at amplitude.
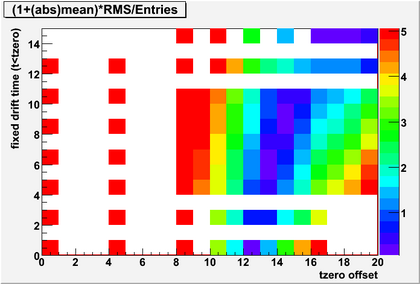
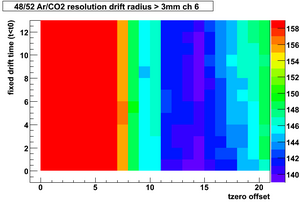
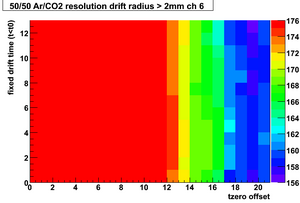
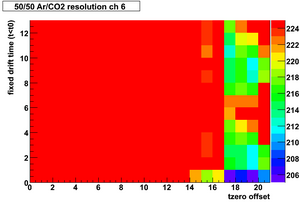
Below: various combinations of tzero offset and fixed drift time (t<tzero)
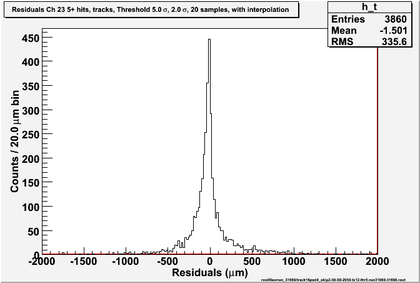
Below: added 13ns to tzero, assigned drift times before tzero to tzero+5ns
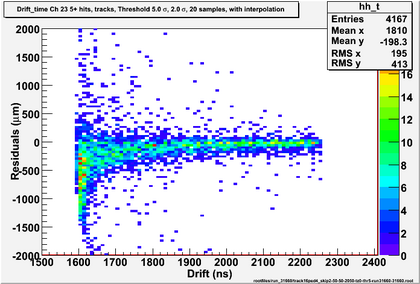
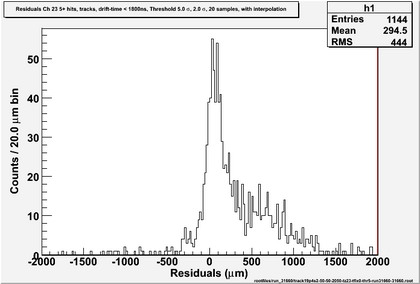
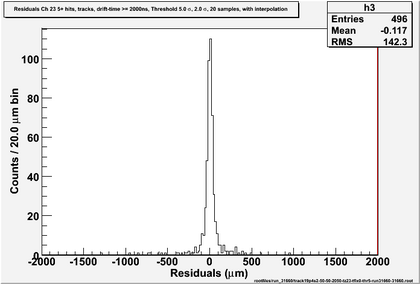
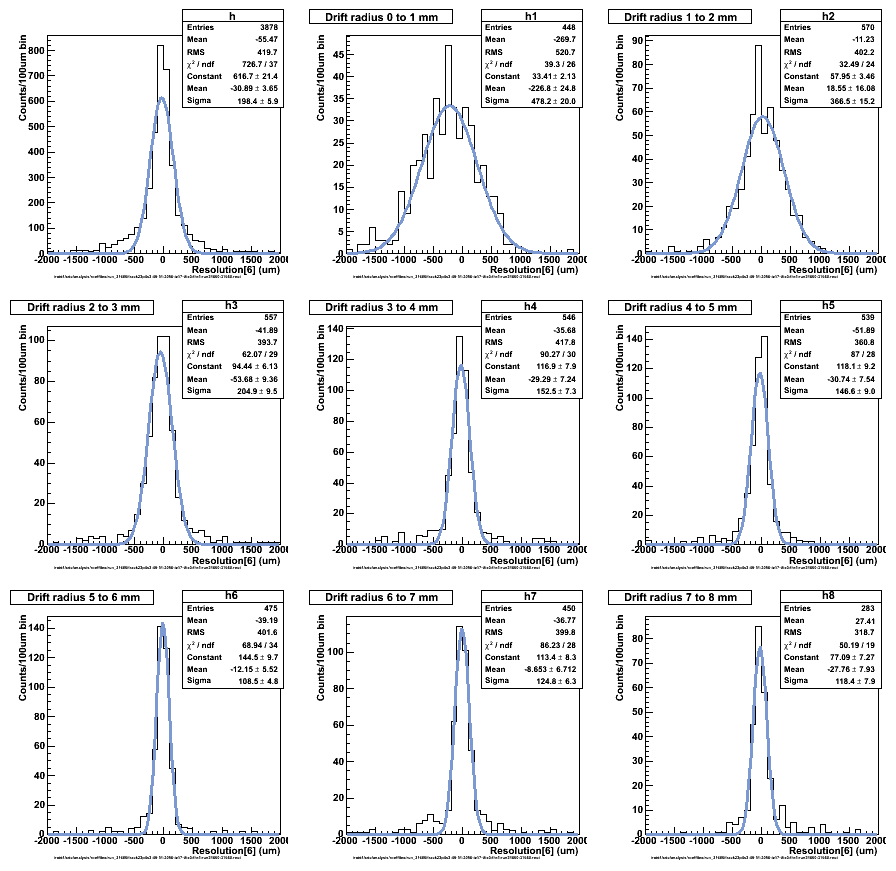
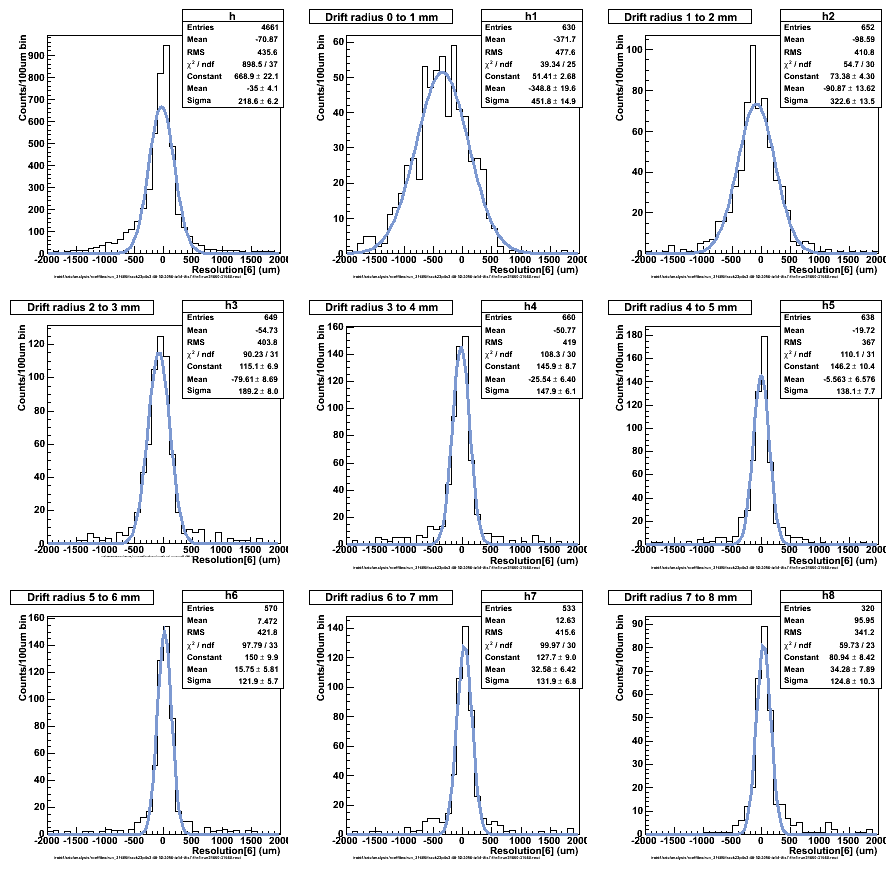
Below: residuals for chunks of drift time
To see what tzero would place the longer drift time mean residuals at zero... tzero offset=23ns. Below: calcs were for times<tzero given drift-time=tzero. Below: residuals for chunks of drift time
Next: look harder at tzero; increase error on times<tzero; try only one high interpolated threshold
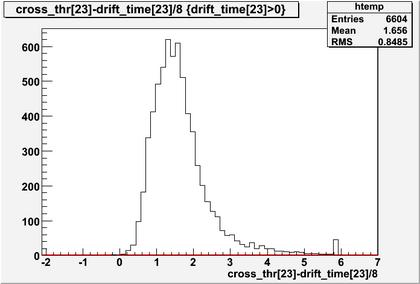
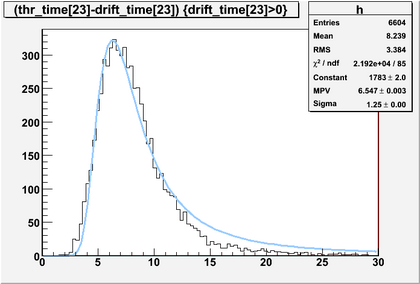
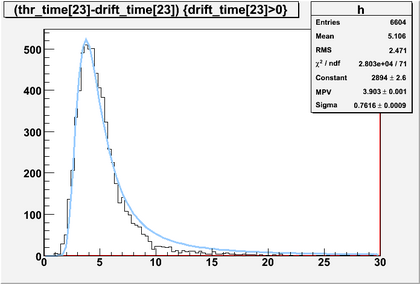
Below: difference (ns) between high 5 sigma and low LE thresholds, used interpolation for both
Below: Single 5-sigma threshold, added 20ns to tzero, assigned drift times before tzero to tzero+4ns
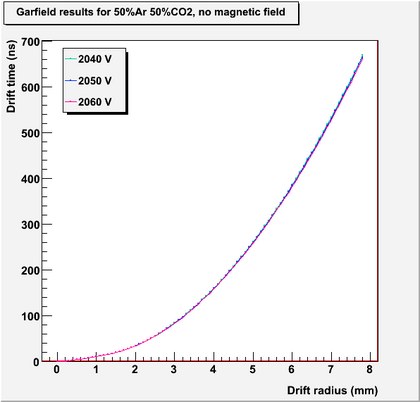
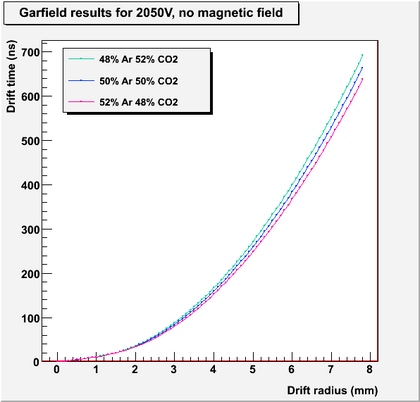
Below: Drift-time and distance calculations from Garfield for various HV and gas mixtures
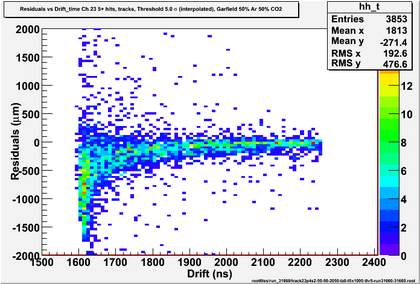
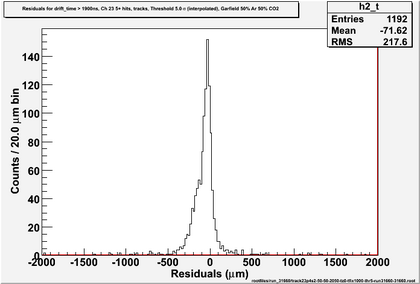
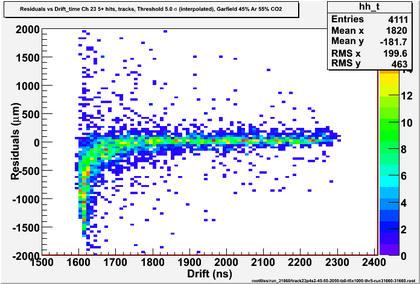
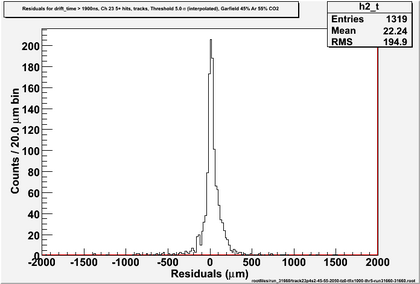
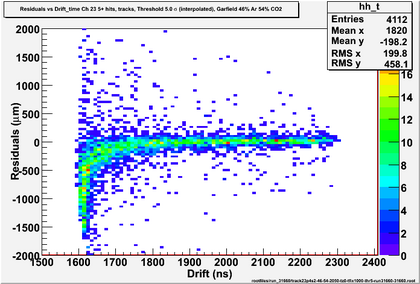
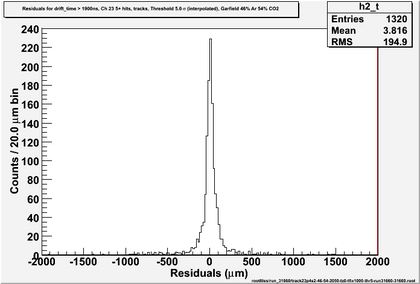
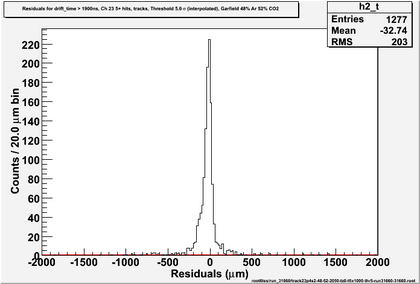
Below: Residuals vs drift time and residuals for drift time > 1900ns using Garfield calcs for various gas mixtures, tzero as fitted, data with drift time < tzero ignored
Look at calcs with pre-t0 counts ignored. Vary t0 and look at resids for chunks of 100ns. Then try another gas mix.
47/53: with 7ns added to t0, mean for >1700ns is -2.8 sigma 65.7; 8ns added, mean is -0.70 sigma 66.7; 9ns added, mean 5.0, is sigma 65.4
48/52: with 13ns added to t0, mean for >1700ns is -4.2 sigma 56.4; 14ns added, mean is -0.67 sigma 56.1; 15ns added, mean is 3.8 sigma 57.5
49/51: with 18ns added, mean for >1700ns is -6.5, sigma 55.2; 19ns added, mean is -2.3, sigma 55.0; 20ns added, mean is 2.4, sigma 57.9
50/50: with 26ns added, mean for >1700ns is 0.6, sigma 64
Look up max td for diff gas mixes, assign early events to some time, maybe early could mean < x ns.
Ar/CO2 max drift times: 47% Ar 706 ns, 48% Ar 692 ns, 49% 680 ns, 50% 665ns
49/51: 19ns added to tzero; events at time < new tzero assigned to (nothing ("1000")), 6,7,8ns.
49/51: 19ns added to tzero; events at time < new tzero assigned to (nothing ("1000")), 6,7,8ns.
Look at diff gas mix again with wider residuals range shown.
Pick 47/53 first for width at t>1800ns, adjust t0 to set mean~0 for t>1800ns events
48/52, adjust t0 to set mean~0 for t>1800ns events, added 16ns to t0 (+15ns put t>1800 mean at -1.1, RMS 195, t>1650 mean at -10, RMS 268)
48/52, + 17ns gives slightly smaller RMS and slope is also less
49/51, try to adjust t0 to set mean~0, closest it gets is at +23ns mean ~0 for >1800ns but mean~14 for >1650 ns and ~55 overall
49/51, +19ns looks better with mean similar for >1650 and >1800 ns and 4 overall
48/52, + 17ns, events before t0 assigned to 2ns (so measured drift time -> drift time - 17ns, or 2ns if -ve)
Without interpolation: 48/52, + 17ns, events before t0 assigned to 2ns (so measured drift time -> drift time - 17ns, or 2ns if -ve)
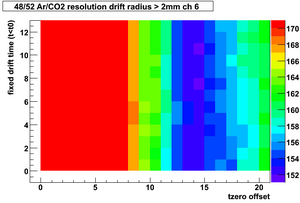
48/52, resolution for drift radius >3mm,2mm,1mm,all for various tzero increment (tz) and time assigned to early events (z)
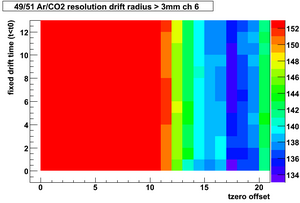
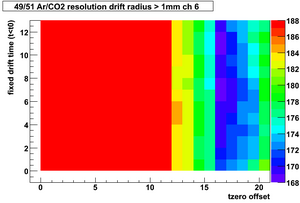
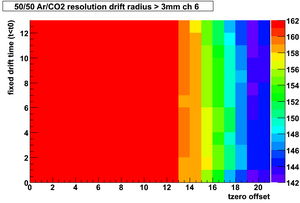
Resolution is sigma of gaussian fitted to distribution of difference in fitted drift radius for the wire in question including all hits and excluding its own hit
|
File:Run 31660 4852 res all.png Resolution using Garfield calcs for 48/52 Ar/CO2 |
49/51, resolution for drift radius >3mm,2mm,1mm,all for various tzero increment (tz) and time assigned to early events (z) Resolution is difference in fitted drift radius for the wire in question including all hits and excluding that same wire's hit
50/50, resolution for drift radius >3mm,2mm,1mm,all for various tzero increment (tz) and time assigned to early events (z) Resolution is difference in fitted drift radius for the wire in question including all hits and excluding that same wire's hit
49/51 tz increment 17ns tfix (time assigned to early events) 0ns
49/51 tz increment 17ns tfix (time assigned to early events) 7ns - tz increment 16 & 17, tfix 6 & 7 gave similar resolution so picked the smallest mean
48/52 tz increment 14ns tfix (time assigned to early events) 7ns
