Monte Carlo simulation of the CHESS C1 beamline
Using the C1 beam line Si(111) monochromator, the narrowest rocking curves we could obtain were of order 150 μr fwhm. This width was understood as coming from dispersion, due to the large energy width of the monochromated beam. The advantages of this setup were that the beam intensity was higher than we needed and the beam size filled the 12mm x 15mm beam line aperture. With such a large beam it was possible to expose the entire diamond in a single scan.
As a means to narrow the energy distribution of the beam, a second monochromator was installed between the C1 monochromator and the diamond. It was a symmetric channel-cut silicon (220) cyrstal. We rotated the crystal about the (220) axis by a few degrees to get rid of the (224) and higher reflections. The narrowest rocking curve width we saw with the second monochromator in place was about 20 μr fwhm, still larger than the intrinsic Darwin width of diamond (220) of 7 μr at 15 keV, but much better than before. However the vertical beam dimension was now reduced from 12 mm down to about 3 mm.
A Monte Carlo program has been written to simulate the behaviour of the C1 beam line for diamond rocking curve measurements. The Monte Carlo will be used to
- reproduce the observed rocking curve widths,
- explain why the second monochromator reduced the beam size,
- test ideas for a new monochromator that can combine high definition with a large beam spot size and good intensity.
MC results for initial C1 setup
The Monte Carlo program was used to simulate the C1 beam line under the following conditions.
- vertical source size 1.43 mm rms,
- flat source spectrum over the range 14.89 - 15.11 keV,
- distance from source to first monochromator 10.1 m,
- first monochromator is Si(111) with b=8.5,
- second monochromator (when present) is Si(220) with b=1,
- diamond scanned ±500 μr around the (220) peak at 15 keV.
All scattering takes place through a pixel in the center of the diamond of negligible size. One can examine the behaviour at other locations on the diamond by shifting the source position up and down.
The following plots show that the simulation is able to reproduce the observed minimum widths under conditions without and with the second monochromator installed. X-rays of random initial energy and direction were generated as described above. As the wave was reflected from each surface, the probability of reflection was computed based on the rocking curve width of the appropriate crystal planes. The product of all probabilities was used at the end of the tracking of each X-ray to either accept or reject it. For each accepted event, the energy and angles for the event were recorded [1].
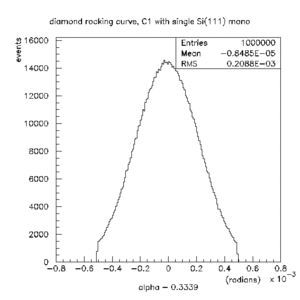 Rocking curve for diamond (220) without the second monochromator (eps). |
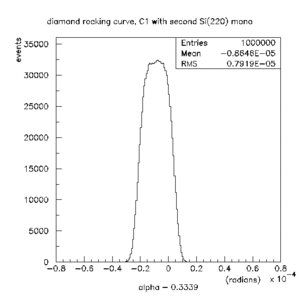 Rocking curve for diamond (220) with the second monochromator (eps). |
The following plots show the reason why the second monochromator reduced the beam size. What is plotted is the θ angle of the X-ray as it emerges from the source, for all rays that survive to the detector. Because of dispersion, there is a strong correlation between θ and k, ie. rays at large θ are biased high in k. The large θ acceptance of the single-monochromator setup has the consequence that the entire source distribution is 'seen' by the spot in the center of the diamond.
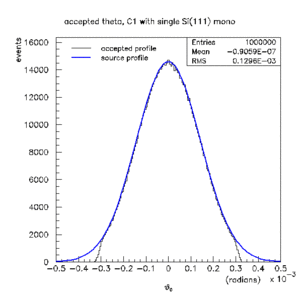 Accepted θ distribution for diamond (220) without the second monochromator (eps). |
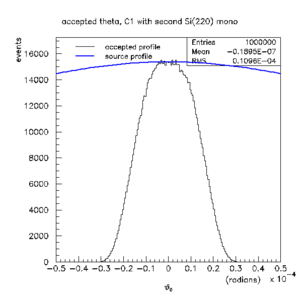 Accepted θ distribution for diamond (220) with the second monochromator (eps). |
This confirms that the X-ray beam spot is large (fwhm > 8 mm) in this configuration. The same plot is shown on the right when the second monochromator is in place. In this case the situation has changed, and the allowed range in θ is a small fraction of the total source size. Note that the blue curves are the same in the two plots. Sweeping the source across this window would produce a beam with the same vertical size as the source itself. The specified value for the vertical spot size of the CHESS C1 line is 1.43 mm rms. Assuming the spot is gaussian, this leads to 3.3 mm fwhm in good agreement with the size of the beam we observed with the second monochromator in place. We conclude that the monochromator diffraction conditions are what is limiting the vertical beam size, and not slit sizes.
MC results with reduced spot size
The above plots for the case without the second channel-cut Si(220) monochromator show a minimum diamond rocking curve that seems too wide compared with what was seen by roughly a factor of two. The simulations were repeated under the same conditions as before, but with the rms vertical source size reduced to 0.7 mm. The following plots show the revised results. These plots were generated using a Monte Carlo generated broad-band beam with a gaussian source spot profile a distance 10.1 m from the first monochromator crystal. Each generated ray that reflects from all beam line elements in the setup produces a count in the plot for that run. The four plots represent four different runs under different conditions. The top two measure the relative count rate of rays after the final reflection from the diamond(220) planes as a function of α, the diamond rocking angle. They correspond to the rocking curve observed in an actual measurement for an ideal diamond without (left) and with (right) the second Si(220) monochromator. The bottom two look at the count rate in the beam incident on the diamond as a function of the original angle at which the ray arrives at the first monochromator from the source. These plots measure to what degree the entire source, or only a slice of it, contributes flux to the beam seen by the diamond.
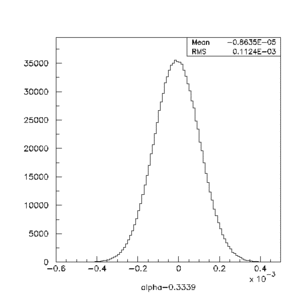 Rocking curve for diamond (220) without the second monochromator (eps). |
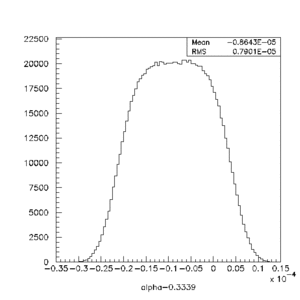 Rocking curve for diamond (220) with the second monochromator (eps). |
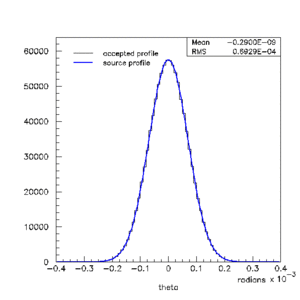 Accepted θ distribution for diamond (220) without the second monochromator (eps). |
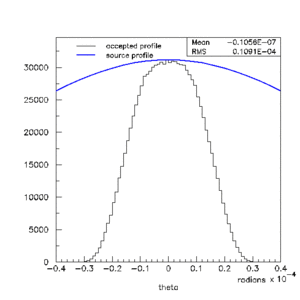 Accepted θ distribution for diamond (220) with the second monochromator (eps). |
One sees that without the second Si(220) monochromator (left plots in the above figures), it is the actual angular source size that determines the angular divergence of the beam at the diamond. The lower left plot shows that the accepted angular profile exactly matches the source intensity profile. With the second monochromator in place, the scattering condition cuts deeply into the intrinsic spread of the beam, producing a beam which is better defined in both energy and angle by a factor of about 12, but which only sees rays originating within a narrow stripe through the center of the source spot that is only about 1/7 of its full vertical height.
References
- Monte Carlo results are available online in the form of hbook ntuples from the GlueX Monte Carlo simulations database