PMT Response linearity test
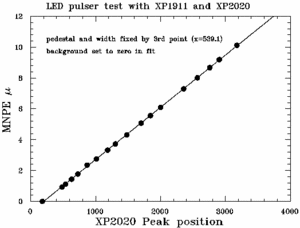
In the fiber tests the one end of the fibers is polished and coupled to an XP1911. From the response of the PMT as given by the ADC spectrum the mean number of photo electrons is extracted. The response depends on the location of the Sr90 source positioned along the fiber. In order to test the linearity of the PMT or rather the linearity of the extraction of the mean number of photo electrons from the fit to the ADC spectrum a blue LED was used to test this. From the LED two fiber light guides emerge. One fiber is coupled directly to an XP2020 PMT set at about -1700V. The other fiber is positioned at a distance from the XP1911 PMT such that the number of photo electrons is between 0 and 10 depending on the voltage applied to the LED while the number of photo electrons in the XP2020 PMT is large and results in a Gaussian peak in the ADC spectrum. The mean number of photo electrons seend by the XP1911 PMT is then plotted against the peak position of the XP2020 PMT ADC spectrum representing the light output of the LED. The result is shown below:

The mean number of photo electrons is given by a fit to the ADC spectrum of the XP1911 PMT. In order to simplify the fit the pedestal and single photo electron peak has been determined by a fit to the ADC spectrum of the third lowest point in this plot. For all other points the pedestal and single photo electron peak has been fixed and the only free parameter in the fit was the mean number of photo electrons.